
Forex Fundamental Analysis: How to Read Economic Surprises
Published
By NextTrade Editorial

Fundamental analysis in forex evaluates a currency's intrinsic value by examining economic, social and political factors that influence its supply and demand relative to other currencies. Traders who use this approach track economic indicators such as interest rates, inflation, employment data and trade balances to form directional views on currency pairs. This contrasts with technical analysis, which focuses on price charts and historical patterns. Many traders combine fundamental analysis to identify which direction a currency may move, then use technical signals to time entry and exit points.
Quick answer: How traders apply economic data to currency trading
Fundamental analysis in forex works by connecting real-world economic events and data releases to expected currency strength or weakness. When a central bank raises interest rates, for example, that currency typically attracts foreign investment and strengthens. Weak employment figures often weaken a currency. Traders monitor economic calendars, central bank statements and geopolitical developments to build a hypothesis about where a currency pair is likely to move, then execute trades based on that view. The market's reaction depends not only on the data itself, but on whether the outcome matches what traders expected in advance.
What the term means: Economic fundamentals in currency markets
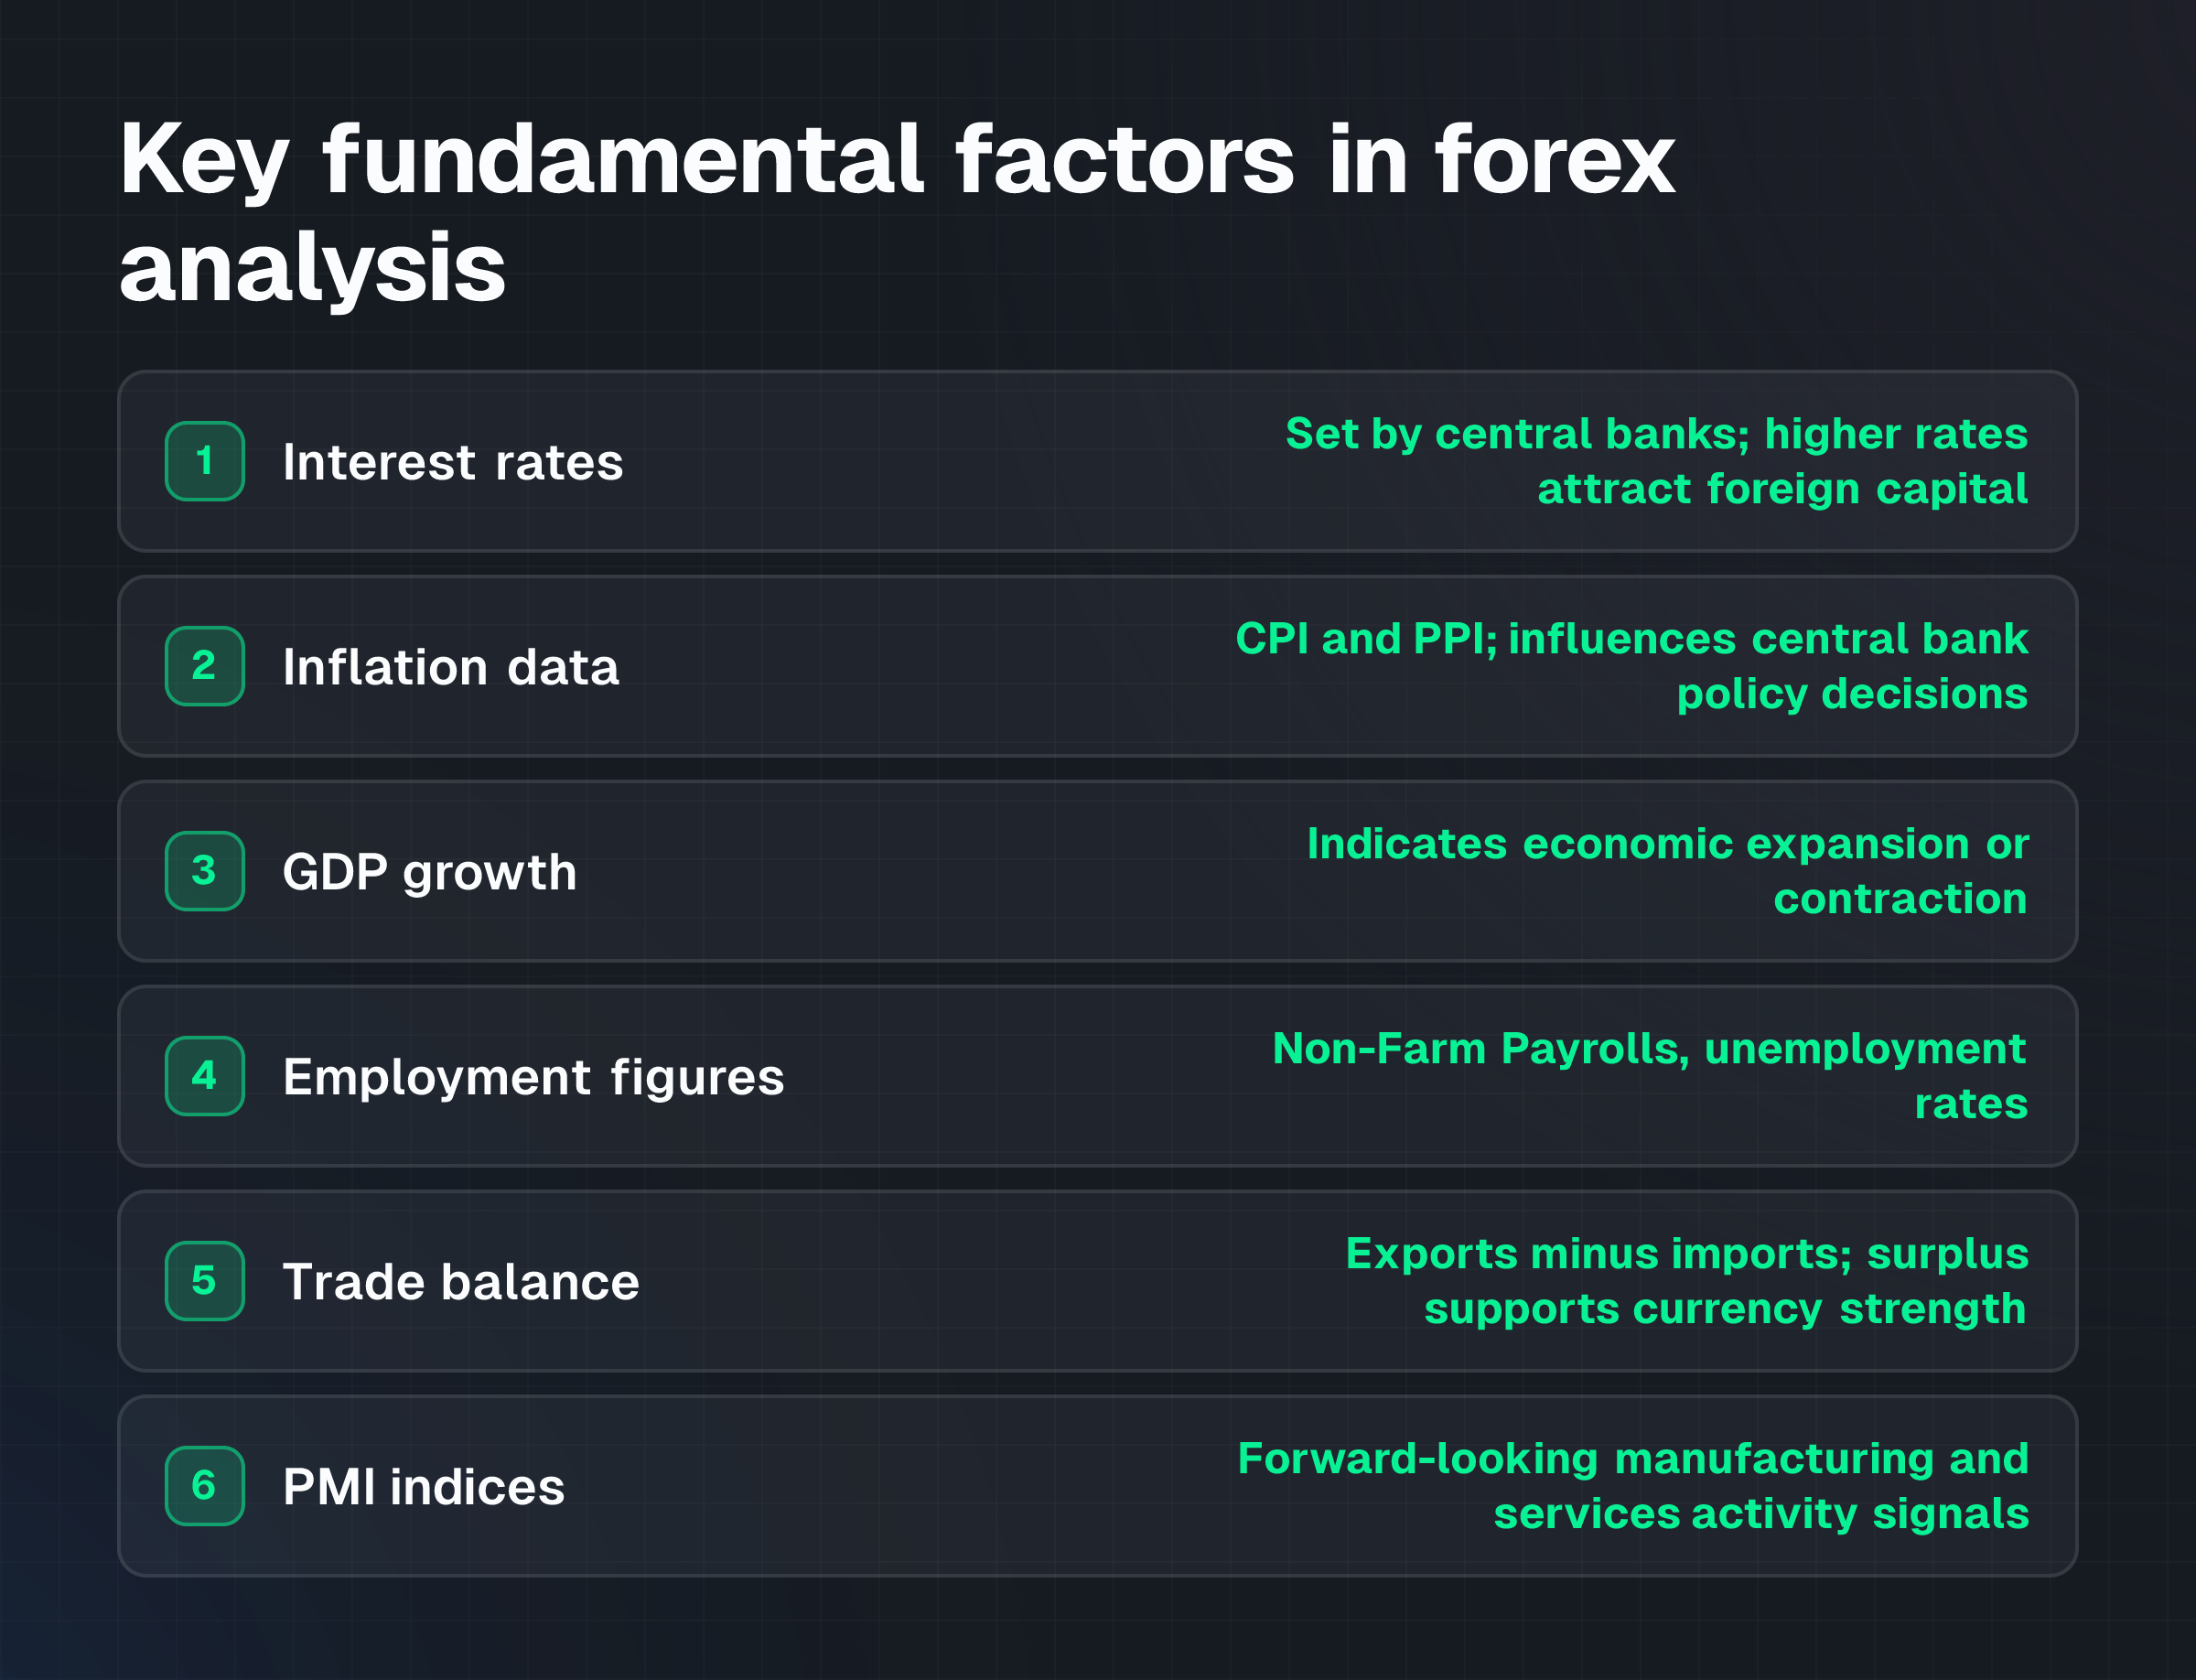
Fundamental analysis in forex means evaluating the factors that should theoretically determine a currency's fair value. These factors fall into several categories.
Economic indicators are regular data releases that signal economic health. Interest rates set by central banks (such as the Federal Reserve, European Central Bank or Bank of England) directly affect currency attractiveness because higher rates typically attract foreign capital seeking better returns. Inflation data, measured by the Consumer Price Index (CPI) and Producer Price Index (PPI), influence central bank policy and the purchasing power of a currency. Gross Domestic Product (GDP) growth indicates whether an economy is expanding or contracting.
Employment figures reveal labour market strength. Non-Farm Payrolls and unemployment rates matter. Trade balance (exports minus imports) shows whether a country is a net seller or buyer internationally; a surplus often supports currency strength, while a deficit can weaken it. Retail sales measure consumer spending and economic confidence. Manufacturing and Services Purchasing Managers' Indices (PMIs) are forward-looking signals of economic activity, published before official data.
Central bank communications and policy carry enormous weight. Statements from central bank meetings, press conferences and monetary policy announcements telegraph future interest rate changes and quantitative easing or tightening decisions. Traders watch for shifts in language or guidance that signal policy direction.
Political stability and geopolitical events affect investor confidence. Elections, government policy changes, international conflicts and domestic political shifts can drive capital flows and currency volatility.
Market sentiment, influenced by news and economic surprises, impacts short-term currency movements. When actual data diverges sharply from market consensus forecasts, volatility often follows.
How it works: The process of analysing and trading on fundamentals
Traders using fundamental analysis typically follow this process.
Track scheduled economic releases. Resources like ForexFactory publish economic calendars showing when major data will be released and what market consensus expects.
Compare actual data to forecasts. The market reaction often depends on whether data beats, meets or misses expectations rather than on the absolute number. Strong employment data that still falls short of expectations may disappoint traders who priced in a larger beat.
Monitor central bank communications. Traders parse the language, tone and guidance in statements and speeches to infer future policy direction.
Assess geopolitical developments. Major global or domestic events can shift investor flows and risk appetite, moving currencies even when economic data is stable.
Form a directional hypothesis. Based on this analysis, a trader develops a view that a specific currency pair should strengthen or weaken over a defined timeframe.
Decide on timing and entry. Many traders combine fundamental analysis with technical analysis at this stage, using chart patterns or technical indicators to refine when to enter and exit a trade, rather than relying on fundamentals alone.
The time horizon varies. Some traders hold positions for weeks or months based on structural economic themes; others trade the immediate volatility around data releases.
Worked example: Hypothetical EUR/USD trade based on interest rate expectations
Assume the European Central Bank is expected to announce an interest rate decision. Market consensus forecasts no change from the current 3.5% rate. In the weeks before the announcement, economic data from the eurozone shows persistent inflation above the ECB's 2% target.
A trader analyses that the ECB may signal a more hawkish stance and hint at future rate increases. The trader forms a view that EUR/USD should strengthen because a higher expected euro rate would attract foreign investment.
Before the announcement, EUR/USD trades at 1.0800. The trader enters a long position (buys EUR, sells USD) at this level. On announcement day, the ECB holds rates unchanged but signals that future increases remain possible. The market interprets this as more hawkish than expected. Demand for euros rises. EUR/USD climbs to 1.0850 within hours.
The trader closes the position at 1.0850, capturing a 50-pip profit on a standard lot. The gross profit is $500 (50 pips × $10 per pip on a standard 100,000-unit lot). This is before costs. If the trader used NextTrade's Standard Account with a 1.3-pip spread, the round-trip cost is approximately $13. On a Raw Account with 0.0-pip spreads but $6-7 per lot round-trip commission, costs are $6-7 per lot. The net profit would be $487-494 after costs, depending on account type.
This example is hypothetical and educational only. It illustrates how economic data, expectations and market reaction combine in fundamental analysis. Past price movements do not establish what will happen next. Actual trades may incur slippage, overnight financing charges, and larger costs if prices move against the position.
Spreads from 0.0 pips across 130+ instruments. Open Account
Costs and practical constraints: Expenses and real-world limits
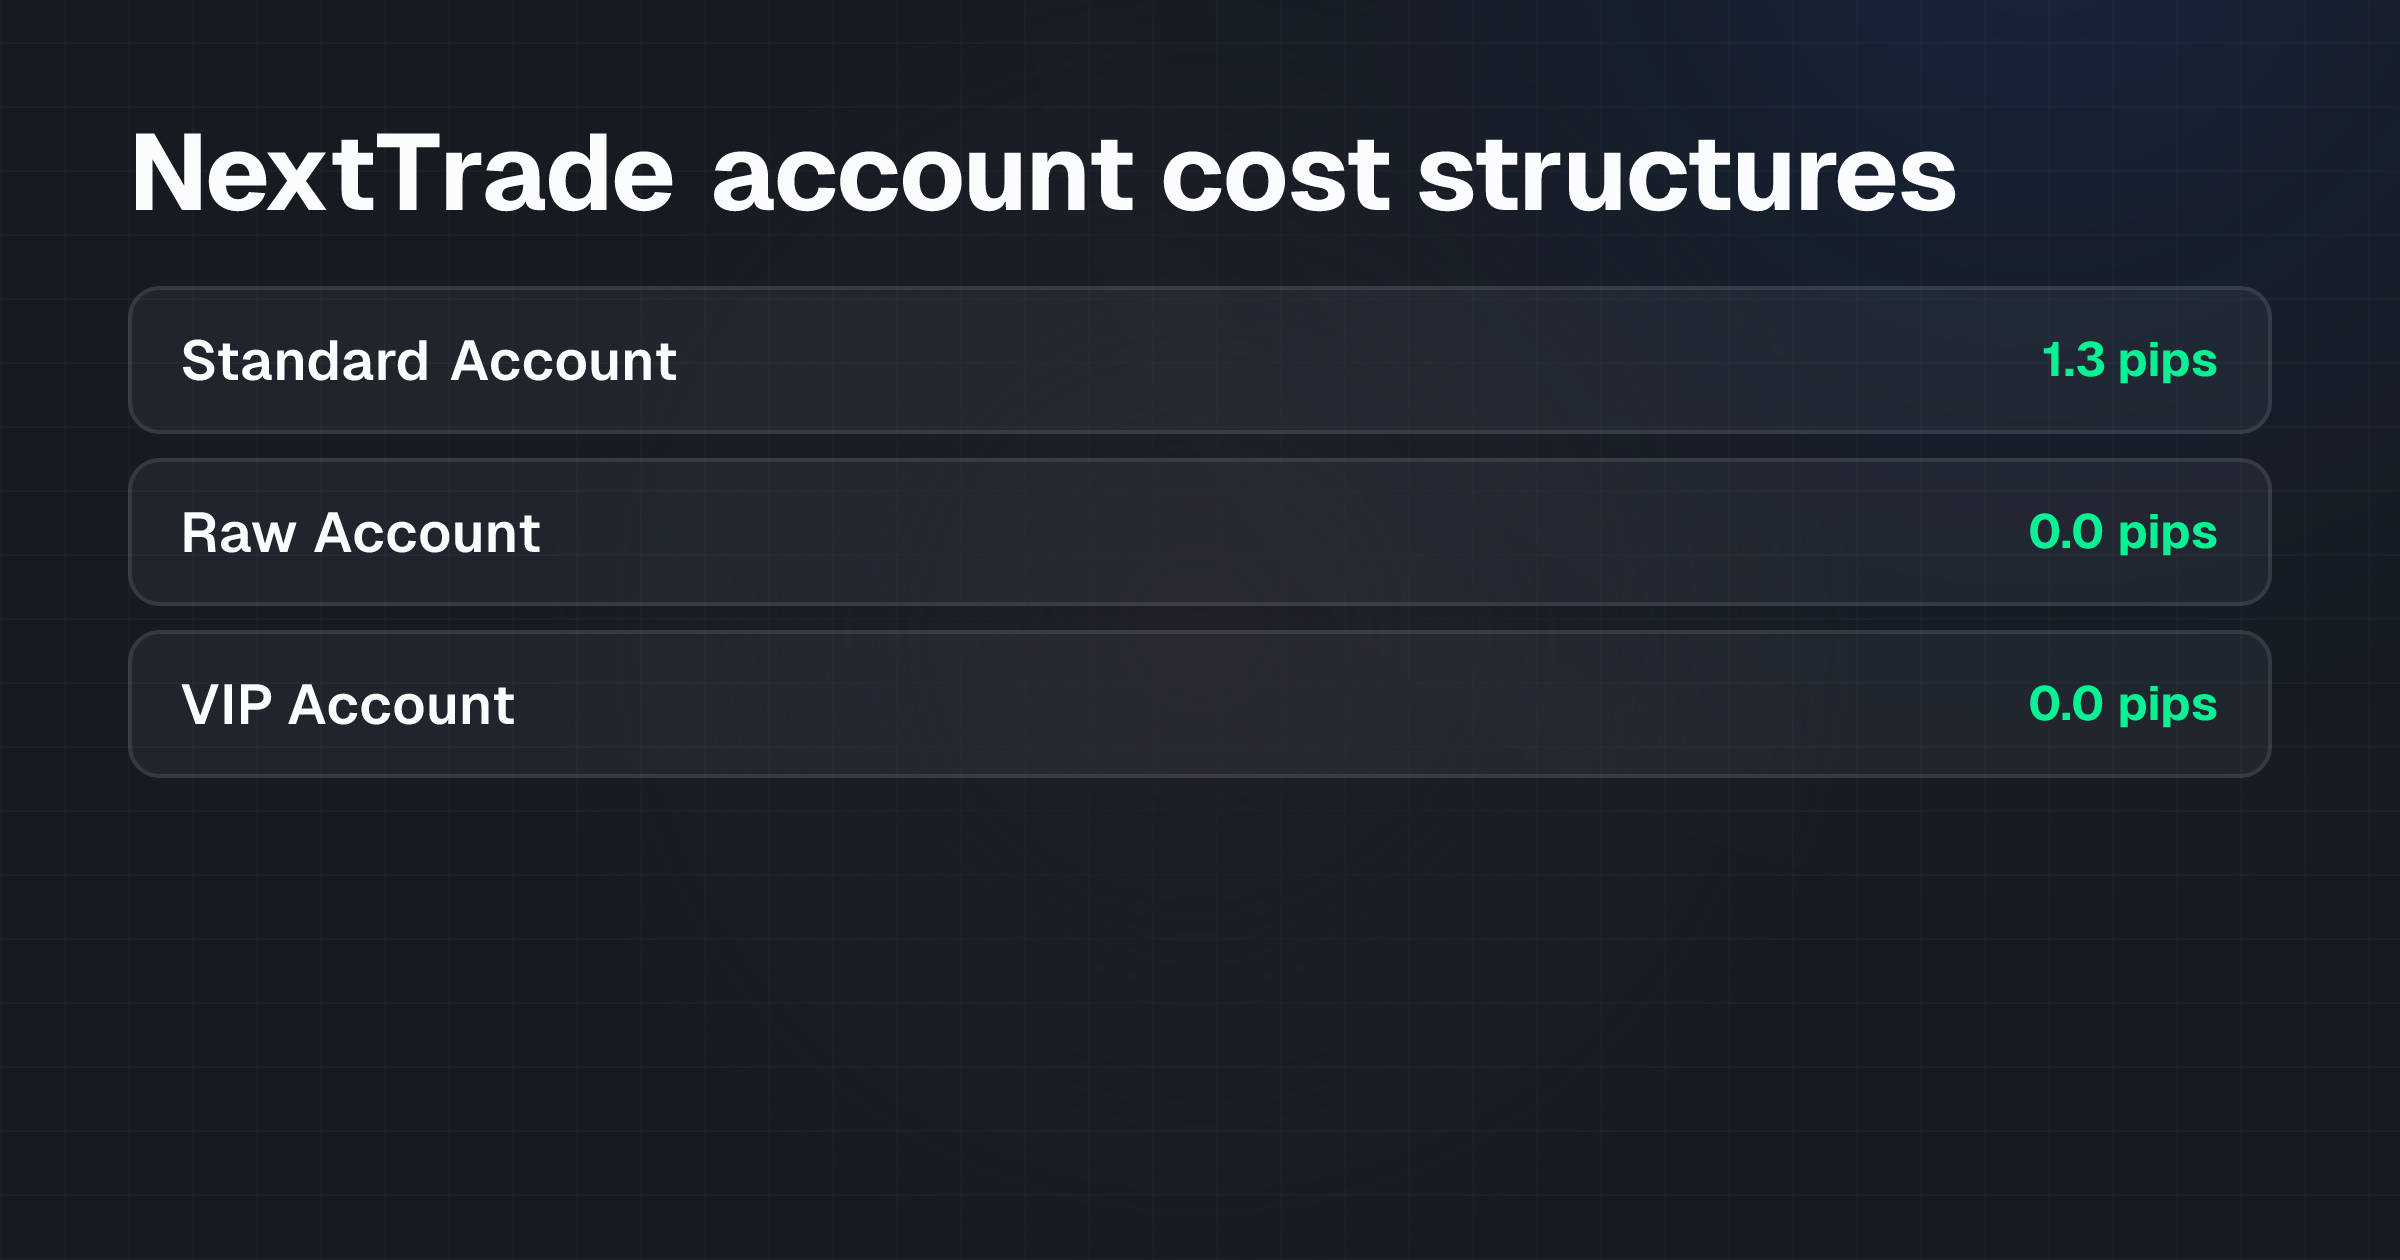
Fundamental analysis itself is free, but executing trades on those ideas incurs costs. Spreads, commissions and overnight financing all reduce profitability.
Spreads and commissions represent the direct transaction costs in Forex trading. NextTrade's Standard Account features spreads starting at 1.3 pips on EUR/USD with no commission. The Raw Account has spreads from 0.0 pips but incurs a fee of $6-7 per lot round-trip. The VIP Account offers spreads from 0.0 pips and charges $4 per lot round-trip for larger accounts with a minimum deposit of $10,000. Selecting the appropriate account type is influenced by trading frequency and position size.
Overnight financing applies when positions are held across the daily settlement. The cost depends on the interest rate differential between the two currencies and the direction of the position. A trader long a high-yield currency and short a low-yield currency may earn overnight financing; the opposite incurs a cost.
Slippage occurs when market prices move between the moment a trader places an order and the moment it executes, especially during volatile periods such as data releases. Major economic announcements can cause rapid price movements, increasing slippage risk.
Leverage increases both exposure and costs. While high leverage is available at NextTrade, it can magnify losses as well as gains. Margin requirements also mean traders must maintain minimum account equity; if a position moves too far against them, a margin call forces closure.
Information delays can limit fundamental analysis effectiveness. By the time retail traders see economic data, professional traders and algorithms have already begun reacting. First-movers capture the largest price moves; late entrants may face less favourable prices.
Calendar crowding means multiple high-impact releases sometimes occur on the same day or week, making it harder to isolate the effect of a single data point.
Risks and limitations: Why fundamental analysis alone is incomplete
Fundamental analysis carries significant risks and limitations.
Volatility during news releases can be extreme. Major central bank decisions or employment data can move currency pairs 1-2% in minutes. Traders may face slippage, gapped execution prices, or liquidity constraints. Stop-losses placed too close to entry may trigger on noise; those placed too far expose the account to large swings.
Lagging versus leading indicators create timing problems. GDP data is published weeks or months after the quarter ends. By that time, the market has already absorbed other signals and moved on. Forward-looking indicators like PMIs are more useful for prediction, but they too can mislead.
Market interpretation varies. A strong jobs report might be expected to strengthen a currency, but if the market already priced that in, the currency may fail to rise or even fall if traders decide the data suggests the central bank will pause rate increases sooner than expected. Data can be right but market reaction counterintuitive.
Confirmation bias is a psychological risk. Traders may selectively interpret information to support a pre-existing directional view and ignore signals pointing the other way. This leads to holding losing positions too long or missing reversals.
Unexpected events ("black swans") invalidate fundamental predictions. Geopolitical shocks, sudden policy shifts or natural disasters can move markets in ways no economic model predicted. Fundamental analysis cannot account for the unknowable.
Ignoring technical dynamics is a common mistake. Even if fundamentals strongly support a currency move, price action and supply-demand imbalance on charts matter too. A currency may be fundamentally undervalued but continue falling if technical selling dominates. Conversely, technicals can support a move that fundamentals do not yet justify.
Analysis paralysis can result from too much data. More indicators do not always improve decisions; they can overwhelm and delay action.
Common misunderstandings: Myths about fundamental analysis in forex
Myth 1: Strong economic data always strengthens a currency. In reality, currency strength depends on what the market expected. If strong jobs data was already priced in, the market may not react. If weak data is better than feared, the currency may actually rise.
Myth 2: Fundamental analysis predicts short-term price movement. Fundamentals matter more over weeks and months. Short-term moves are often driven by technical factors, sentiment, and order flow. Fundamental traders holding intraday or scalping face liquidity and volatility hazards.
Myth 3: More indicators mean better analysis. Adding more data sources increases complexity without necessarily improving accuracy. Focus and discipline often outperform excessive analysis.
Myth 4: Historical patterns in economic data repeat. Each cycle differs. Past inflation, growth or employment patterns do not guarantee future outcomes. Market conditions change; policy responses adapt.
Myth 5: You can trade fundamentals without understanding technicals. Technical analysis affects entry timing, exit levels and risk management. Many successful fundamental traders also use charts to refine execution.
Practical checklist: Steps to prepare for fundamental trading
- Subscribe to or bookmark economic calendars (such as ForexFactory) to know release dates and consensus forecasts for your chosen currency pairs.
- Identify which economic indicators matter most to your pairs. Not all indicators affect all currencies equally.
- Set up alerts for central bank announcements, speeches and policy decisions.
- Read central bank statements and meeting minutes to understand policy bias and forward guidance.
- Research the geopolitical landscape of your target countries (elections, major policy debates, international tensions).
- Decide whether you will trade around data releases (high volatility, short timeframe) or use fundamentals to set medium-term directional bias.
- If trading around releases, plan position size, stop-loss placement and slippage tolerance in advance. Volatility can be extreme.
- Combine fundamental analysis with technical analysis to refine entry and exit timing.
- Use stop-losses and position sizing appropriate to your account size and risk tolerance. Leverage amplifies both gains and losses.
- Test your fundamental thesis on historical price action to see how your currency pair has reacted to similar data in the past.
- Keep a trading journal to track which fundamental themes worked and which did not. Review patterns to refine future analysis.
FAQs
What is the difference between fundamental and technical analysis?
Fundamental analysis evaluates economic, political and social factors to determine fair currency value. Technical analysis studies price charts and historical patterns to predict future movement. Many traders use both: fundamentals for directional bias and technicals for entry and exit timing. Neither guarantees profitability; both carry risks of misjudgement or unexpected market moves.
How quickly do currency prices react to economic data?
Reaction is often immediate, within seconds of a data release. Algorithmic trading and professional traders move first, so retail traders entering after the headline may face less favourable prices. Short-term volatility can be severe. Holding through data releases requires larger stop-losses and carries higher slippage risk.
Can I trade fundamentals on a small account?
Yes. NextTrade accounts start from $25 on a Standard Account. Smaller accounts offer less margin for error, though. Leverage up to 1:1000 is available but amplifies losses as well as gains. Position sizing and stop-losses become critical with limited capital. A fundamental trade that moves against you on a small, leveraged account can deplete balance quickly.
Which economic indicators should I focus on?
That depends on your currency pair. For USD pairs, Federal Reserve policy and US employment data matter most. For EUR pairs, ECB policy, eurozone GDP and inflation dominate. For emerging-market currencies, commodity prices and political risk are critical. Start with the three to five indicators most relevant to your chosen pairs rather than tracking everything.
Does fundamental analysis work for all currency pairs?
Fundamental analysis is most reliable for major pairs like EUR/USD, GBP/USD and USD/JPY, where economic data is regular and transparent. For emerging-market or exotic pairs, political risk, central bank credibility and data reliability can be harder to assess. Liquidity also matters; less liquid pairs can exhibit larger spreads and slippage, eroding the edge from correct fundamental analysis.
How long should I hold a position based on fundamental analysis?
That depends on your thesis. If you form a view on a structural economic shift, such as persistent interest rate differentials or diverging growth, you might hold for weeks or months. If you're trading around a specific data release, your window might be hours. Define your timeframe and exit rules in advance, rather than holding hoping for a bigger move.
Next step
Understanding how fundamental analysis works is the first step. Combining it with technical analysis for entry timing, position sizing and risk management, and broker selection gives you a more complete trading framework. NextTrade offers 131 instruments across forex, metals, commodities, indices and crypto CFDs on MetaTrader 5 and TradeLocker, with account types from $25 and leverage up to 1:1000. Test your fundamental thesis on a demo account first, there's no deposit required and no risk to your capital.
CFD risk warning: CFDs are complex instruments and carry a high risk of losing money rapidly due to leverage. Retail investor accounts with this provider lose money when trading CFDs. You should consider whether you understand how CFDs work and whether you can afford to take the high risk of losing your money.
General information disclaimer: This article is educational and does not constitute investment advice, a recommendation to trade, or an offer to buy or sell any instrument. It does not account for your personal circumstances, financial situation or risk tolerance. Past market behaviour does not establish what will happen next. Forex trading carries substantial risk. Always verify current terms and conditions with your broker before opening or funding an account.
TagsTrading Educationfundamental analysis forexforex economic indicatorscentral bank forex tradinginterest rate currency trading