
Forex traders use technical analysis to study past price and volume data in search of patterns and signals that may predict future currency movements. Common strategies include trend trading (following the direction of a prevailing trend), range trading (buying and selling between support and resistance levels), breakout trading (entering when price moves decisively beyond key levels), counter-trend trading (attempting to profit from reversals), and scalping (executing frequent trades for small pip gains). Each strategy uses different tools, moving averages, oscillators like the RSI, chart patterns, and support/resistance levels, and suits different timeframes and risk tolerances. This guide explains how these strategies work, their practical costs, and the risks that make them challenging even for experienced traders.
Quick answer: What technical analysis strategies forex traders use
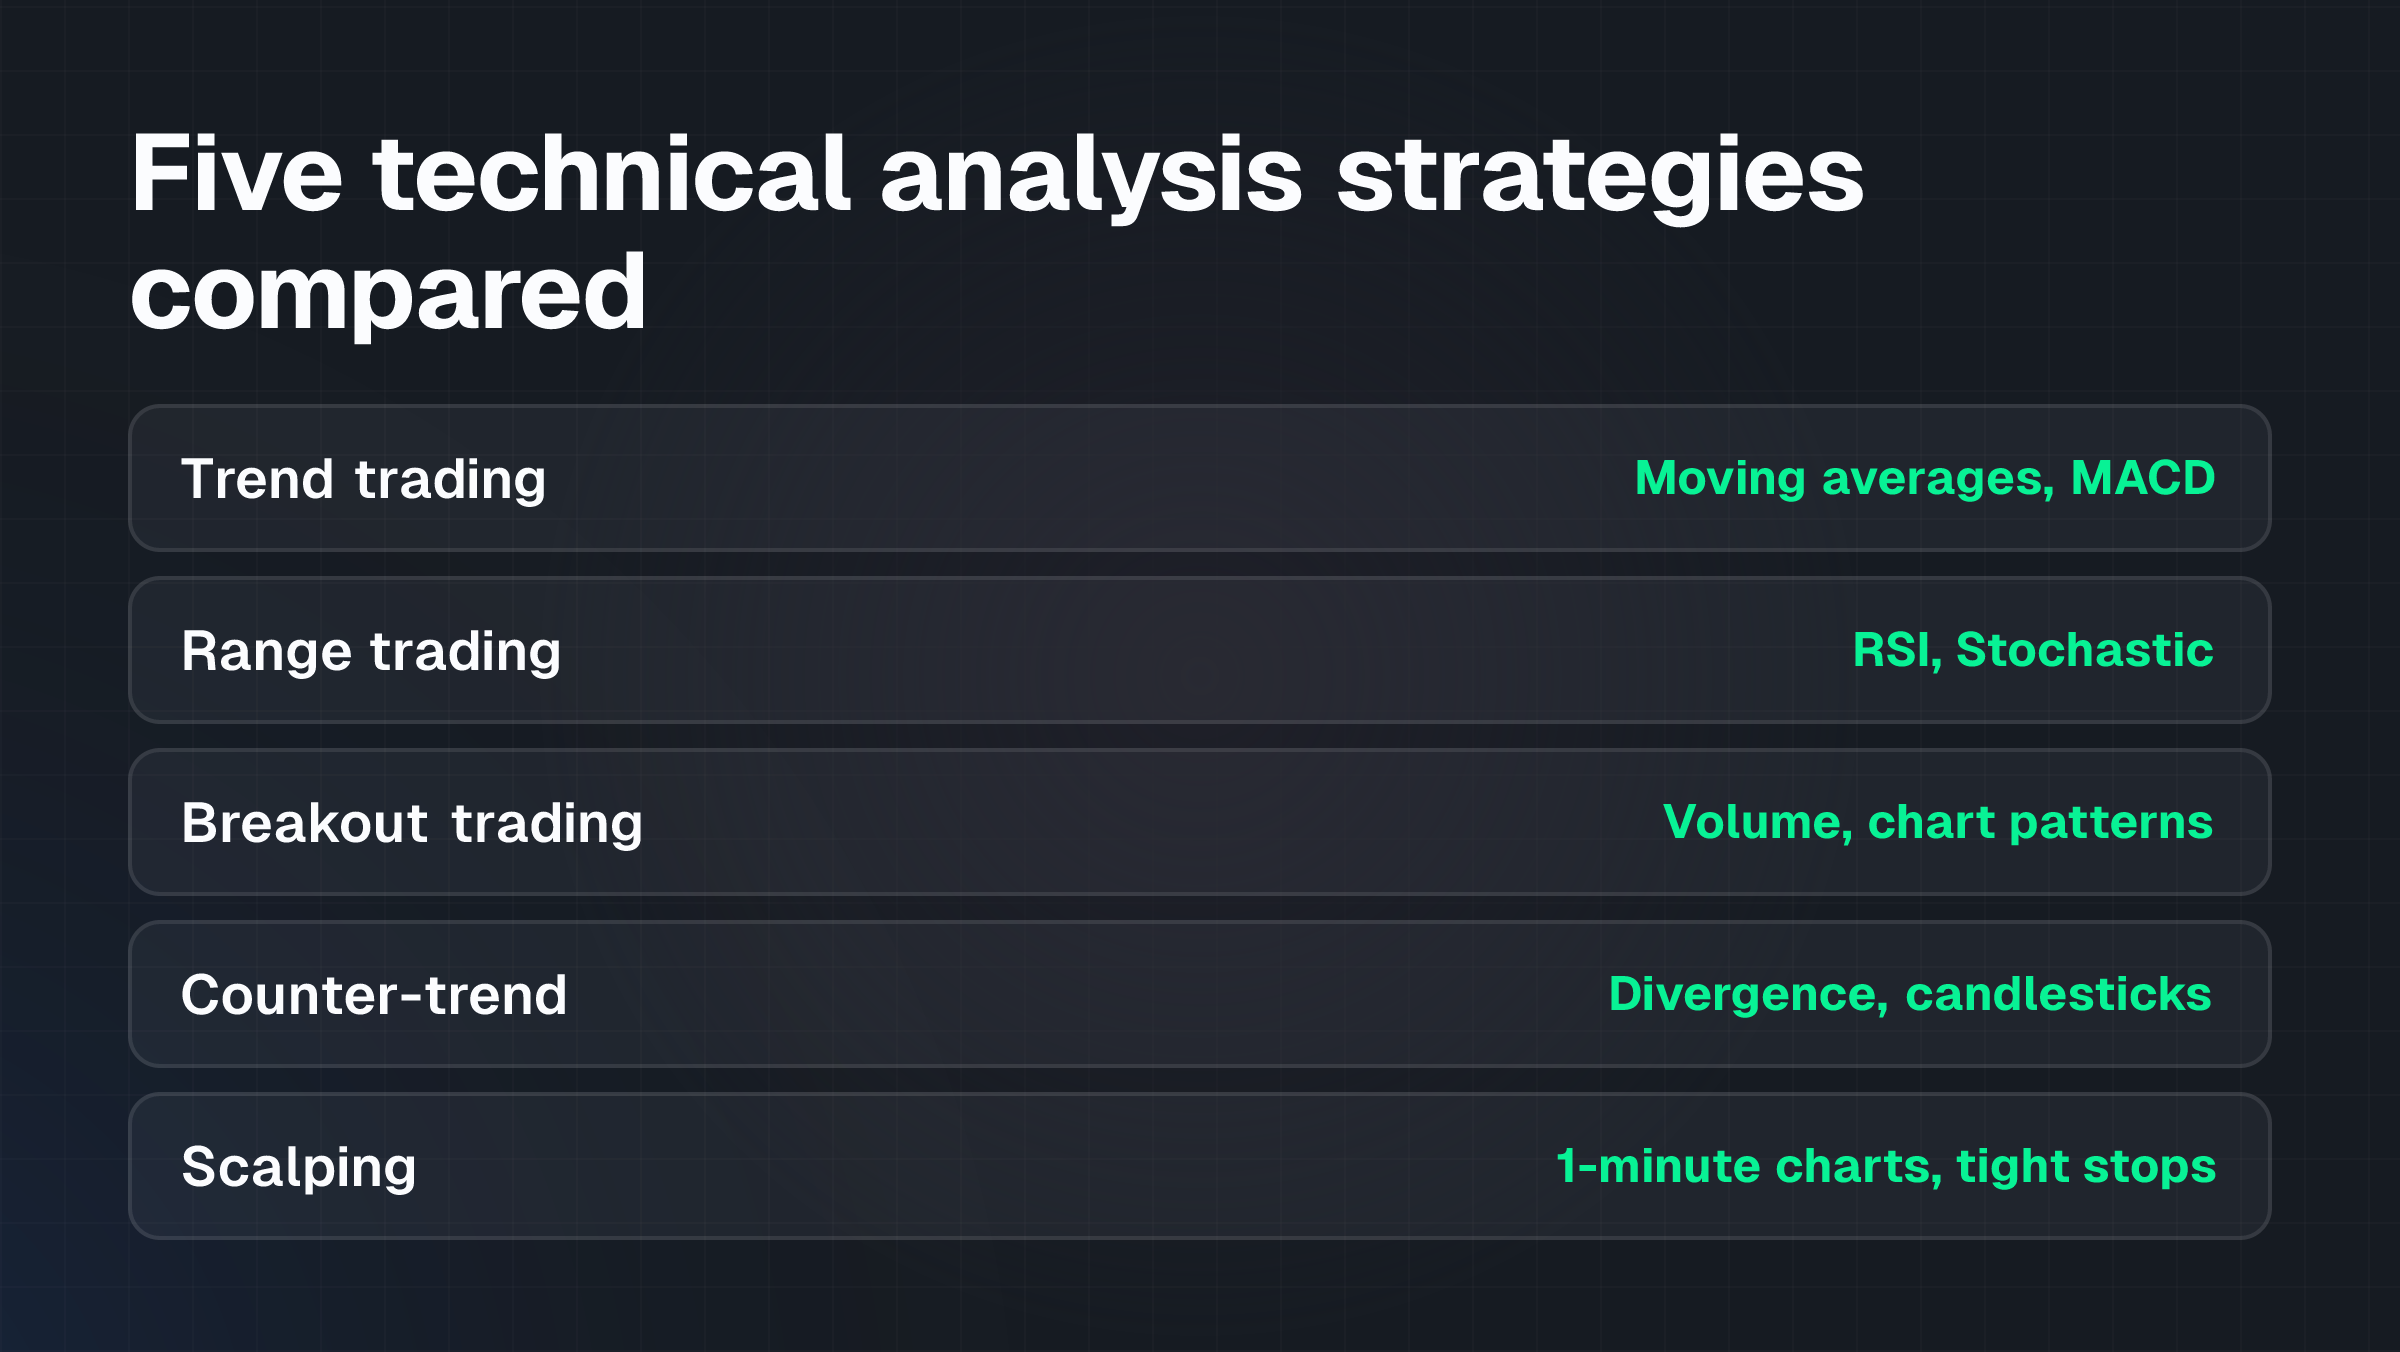
Forex traders rely on five main technical analysis strategies. Trend trading uses moving averages and MACD to enter trades aligned with the market direction. Range trading buys near support and sells near resistance during sideways price action, using oscillators like the RSI. Breakout trading enters when price moves decisively above resistance or below support. Counter-trend trading attempts to catch reversals at the end of a trend, using divergence signals and candlestick patterns. Scalping executes many small trades in minutes or seconds, targeting 5-10 pip gains per trade and requiring tight spreads and fast execution. Each strategy has different capital requirements, transaction costs, and failure rates, past market behaviour does not establish what will happen next.
What the term means: Technical analysis in forex trading
Technical analysis is the study of historical price and volume data to identify recurring patterns and forecast future price movements. Forex traders apply this approach to currency pairs using price charts (candlestick, bar, or line charts), technical indicators (mathematical calculations based on price history), and chart patterns (recognisable formations such as head-and-shoulders, triangles, and double tops/bottoms).
Key concepts include:
- Technical indicators: Calculations that aim to forecast price direction. Trend-following indicators like moving averages and MACD identify the strength and direction of a trend. Oscillators such as the Relative Strength Index (RSI) and Stochastic Oscillator help identify overbought or oversold conditions and potential reversals.
- Support and resistance levels: Price points where buying or selling pressure is expected to halt or reverse price movement.
- Timeframes: The time period over which data is aggregated, 1-minute, 1-hour, daily, or weekly charts. Different strategies suit different timeframes; scalping relies on 1-minute charts, while trend trading works on daily or weekly charts.
- Chart patterns: Shapes like triangles, rectangles, and head-and-shoulders that traders interpret as signals of continuation or reversal.
How it works: Five common technical analysis strategies
Trend trading
Trend trading identifies and enters in the direction of the prevailing market trend. The trader uses moving averages or MACD (Moving Average Convergence Divergence) to confirm trend direction. A classic signal is a moving average crossover: when a shorter-period moving average (such as the 50-period exponential moving average) crosses above a longer-period moving average (such as the 200-period), it may signal an uptrend.
The trader enters a long position. If the 50 crosses below the 200, it may signal a downtrend, prompting a short entry. Trend traders typically use daily or weekly charts and aim to capture sustained directional moves, often holding positions for hours or days.
Range trading
Range trading profits from price oscillating between defined support and resistance levels without a clear trend. The trader buys near support and sells near resistance, using oscillators to time entries. For example, if the RSI (Relative Strength Index) shows an asset is oversold near a known support level, a range trader might buy. When the RSI becomes overbought or price approaches resistance, the trader sells.
This strategy works best during sideways or consolidation phases. It relies on tight spreads and low transaction costs.
Breakout trading
Breakout trading enters a trade when price moves decisively beyond a key support or resistance level, signalling the start of a new trend. The trader watches for price to consolidate in a chart pattern (such as a triangle or rectangle), then places an entry order just above resistance (for a long trade) or just below support (for a short trade). Volume confirmation or increased volatility at the breakout point strengthens the signal.
This strategy often has a low initial win rate but can capture large directional moves if successful.
Counter-trend trading
Counter-trend trading attempts to profit from the reversal of an existing trend, typically at the point where a trend shows signs of exhaustion.
Tools include oscillator divergence (price making higher highs while the RSI makes lower highs) or candlestick reversal patterns (such as engulfing patterns or hammers). This is considered higher-risk because reversals often fail, leaving the trader on the wrong side of a move.
Scalping
Scalping executes numerous trades throughout the day to profit from small price movements, holding positions for only seconds or minutes. A scalper might target 5-10 pip gains per trade using 1-minute charts and tight stop-losses. Success requires low spreads, fast execution, and the discipline to close profitable trades quickly.
Scalping generates high transaction costs because each trade incurs a spread or commission.
Worked example: Trend trading with moving average crossover
This example is hypothetical and educational; it's not a recommendation to trade.
Assume a trader is monitoring the EUR/USD pair on a daily chart. The trader uses a 50-period exponential moving average (EMA) and a 200-period EMA.
- Setup: The 50 EMA is currently at 1.0950, and the 200 EMA is at 1.0910. Both are rising.
- Signal: The 50 EMA crosses above the 200 EMA (the "golden cross"), suggesting an uptrend is forming.
- Entry: The trader places a buy order at market price, say 1.0952.
- Stop-loss: The trader sets a stop-loss 50 pips below entry, at 1.0902, to limit losses if the signal fails.
- Target: The trader aims to sell when price reaches 1.1052, a target 100 pips above entry.
- Outcome (hypothetical): Price rises to 1.1052 over 5 days. The trader closes the position, netting 100 pips. However, if price had fallen to 1.0902, the stop-loss would close the trade for a 50-pip loss.
This example shows how a trend trader uses a simple indicator signal and manages risk with a stop-loss. In reality, trends often fail early, reversals occur, and market gaps can bypass stop-losses. Past price behaviour does not confirm future results.
Spreads from 0.0 pips across 130+ instruments. Open Account
Costs and practical constraints: Trading expenses and platform requirements
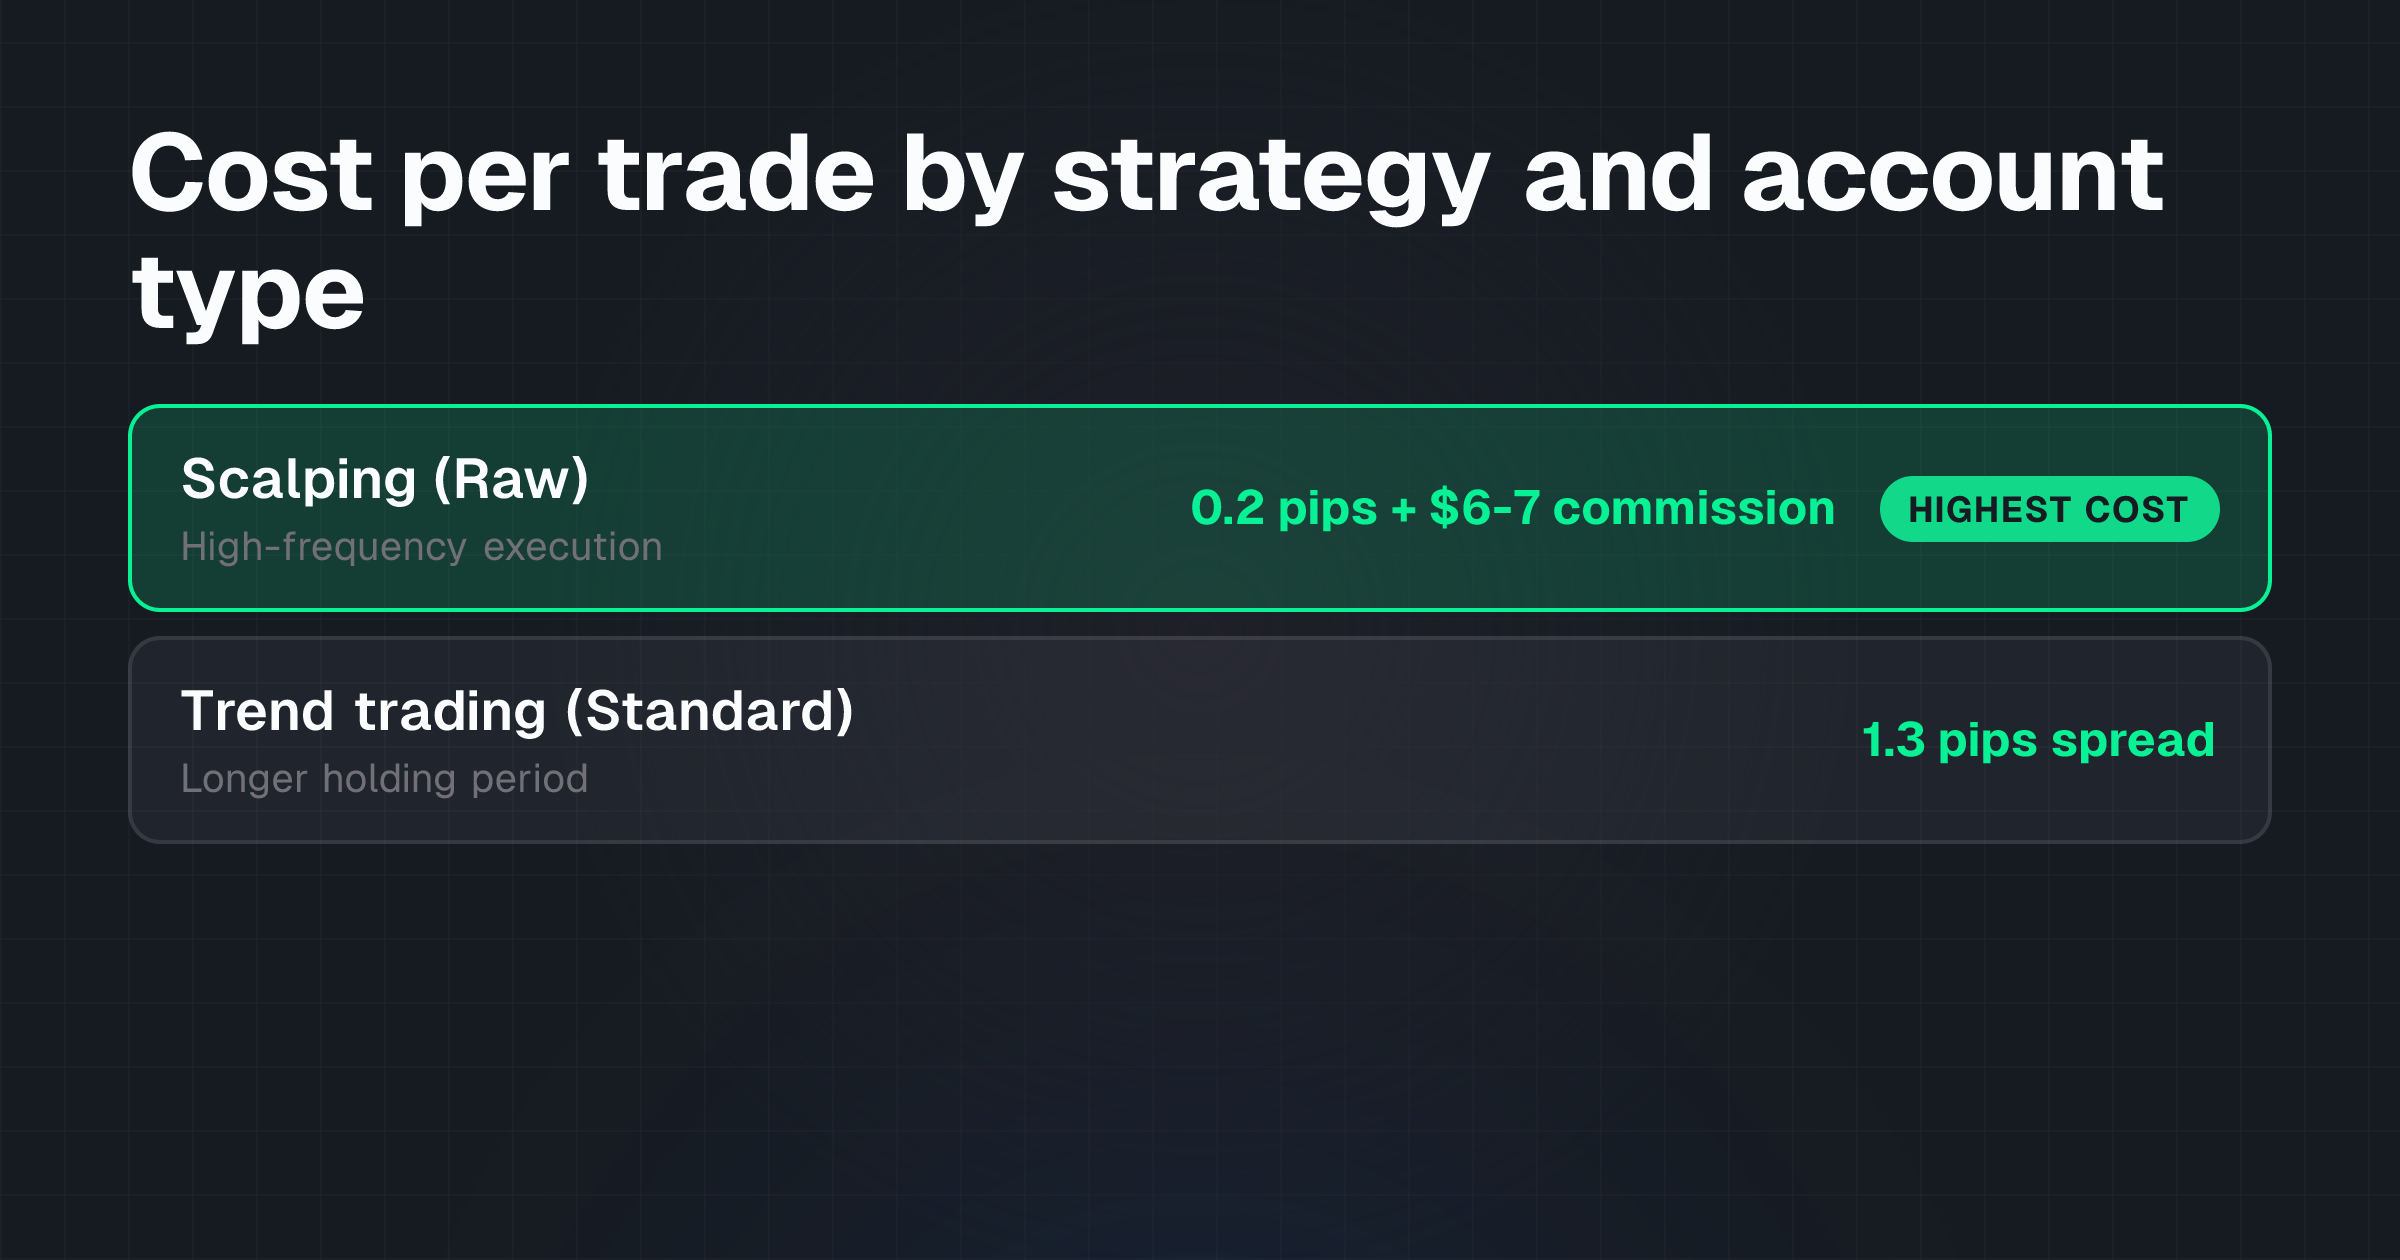
Technical analysis strategies incur transaction costs that vary by strategy type and account structure.
Scalping and high-frequency technical trading: These strategies require the lowest possible spreads and commissions. NextTrade Broker offers Raw accounts from $100 with spreads from 0.0 pips on forex (from 0.2 pips) and a commission of $6-7 per lot round trip. For a trader executing 20 scalp trades per day over 20 trading days (400 trades monthly), the cumulative commission alone is significant. A 10-pip gain per trade must exceed the total spread and commission cost to be profitable. The spread cost on a standard 1-lot trade at 0.2 pips is 2 USD; the commission is $6-7 per round trip. Total cost per round trip: approximately $8-9 per trade. A 10-pip gain at standard pip value ($10 per pip for most pairs) yields only $100, minus $8-9 in costs.
Trend trading and range trading: These strategies suit longer timeframes and fewer trades per week, so they're more compatible with standard account structures. NextTrade's Standard account has no commission and a typical EUR/USD spread of 1.3 pips. If a trader enters and exits one trade per week, the cost is only 2.6 pips of slippage per round trip (1.3 pips entry, 1.3 pips exit).
Platform requirements: Technical analysis requires charting tools with multiple indicators and timeframe flexibility. NextTrade Broker offers MetaTrader 5 and TradeLocker (with TradingView charts), both of which include comprehensive indicator libraries and are widely used for technical analysis.
Leverage: Using high leverage amplifies both gains and losses. NextTrade Broker offers leverage up to 1:1000, meaning a small adverse price movement can wipe out an account quickly. A trader using 1:1000 leverage on a $100 account controls $100,000 in notional currency exposure; a 1% adverse move results in a 100% account loss.
Risks and limitations: Why technical analysis signals fail
Technical analysis carries several structural risks that traders must understand before risking capital.
Lagging indicators: Most technical indicators are derived from past price data. By the time an indicator generates a signal, price has already moved. A moving average crossover that signals an uptrend may occur after price has already risen significantly, reducing the profit potential and increasing the risk of a reversal.
False signals: Indicators and chart patterns produce inaccurate signals frequently. A head-and-shoulders pattern may suggest a reversal, but price could continue upward instead. Traders who act on every signal without confirmation experience losing trades.
Over-optimization: Adjusting indicator parameters (such as moving average periods) to fit historical data perfectly can make a strategy appear highly profitable on paper but perform poorly in live trading. This is called curve-fitting. The parameters that worked best on the past may not work on future data.
Lack of confirmation: Relying on a single indicator increases the chance of false entries. Many traders wait for confirmation from multiple indicators or price action before entering a trade, but this delays entry and reduces potential gains.
Fundamental events override technical signals: Major economic announcements, central bank policy changes, or geopolitical events can cause price to gap past technical support or resistance levels, bypassing stop-losses and triggering large losses.
Counter-trend trading risk: Counter-trend strategies have inherently lower win rates because they bet against the prevailing trend. A trader attempting to catch a reversal may enter just before the trend accelerates in the opposite direction.
Emotional trading: Traders often ignore signals when trades move against them or chase losses by over-sizing subsequent trades. Discipline and a written trading plan reduce this risk but don't eliminate it.
Common misunderstandings: What technical analysis does and does not do
Misunderstanding 1: Technical analysis guarantees profitability.
Technical analysis is a framework for identifying potential trade setups. It doesn't guarantee profits. Many traders lose money using the same indicators and patterns because execution, risk management, market conditions, and random variation all affect outcomes.
Misunderstanding 2: One indicator or pattern is enough to trade.
Relying on a single indicator or chart pattern significantly increases the risk of false signals. Professional traders typically seek confirmation from multiple sources (price action, two or more indicators, or volume patterns) before committing capital.
Misunderstanding 3: Technical analysis works equally well on all timeframes.
Different strategies suit different timeframes. Scalping requires 1-minute or 5-minute charts and extremely tight stops. Trend trading works on daily or weekly charts. Applying a scalping strategy to a daily chart or a trend strategy to a 1-minute chart often fails.
Misunderstanding 4: Past performance predicts future results.
A technical pattern or indicator that worked 80% of the time in the past may perform differently in the future. Market structure, volatility, and participant behaviour change over time. Backtesting a strategy on historical data doesn't confirm it will be profitable in live trading.
Misunderstanding 5: Technical analysis replaces fundamental analysis.
Major economic or political events can override technical signals. A trader who ignores fundamental news and relies solely on technical signals may face large unexpected losses when central banks announce policy changes or geopolitical events occur.
Practical checklist: Steps to evaluate and test a technical analysis strategy
Before risking real capital, follow these steps to evaluate a strategy:
- Define the strategy rules clearly: Write down exact entry conditions, exit conditions, and stop-loss levels. Vague rules lead to inconsistent execution.
- Backtest on historical data: Use your broker's platform or a backtesting tool to run the strategy on 1-3 years of past data. Note the win rate, average win, average loss, and maximum drawdown.
- Forward test on a demo account: Run the strategy on a free demo account in live market conditions for at least 2-4 weeks. This reveals how the strategy performs in real-time market conditions without risking capital.
- Check for curve-fitting: If backtesting results are unrealistically good (e.g., 95% win rate), the strategy may be over-optimized to historical data. Reduce indicator parameters to more conservative settings and retest.
- Confirm multiple indicators or price action: Don't enter trades based on a single indicator signal. Wait for a second confirmation source (another indicator, candlestick pattern, or support/resistance bounce).
- Calculate transaction costs: Multiply the number of trades per week by the total cost per round trip (spread + commission). Ensure your average win per trade exceeds your average transaction cost.
- Set position size and stop-loss before entering: Use a position sizing framework that limits each trade's loss to a fixed percentage of your account, typically 1-2%.
- Track trades in a journal: Record entry price, exit price, reason for entry, and reason for exit. Over time, this reveals whether your execution matches your strategy rules and where the largest losses occur.
- Revisit and revise: Periodically review backtest results and live trading results. If the strategy isn't performing as expected, investigate whether market conditions have changed or whether you're executing the rules inconsistently.
Frequently asked questions
What is the difference between technical analysis and fundamental analysis?
Technical analysis studies historical price and volume data to forecast future price movements. Fundamental analysis studies economic data, interest rates, inflation, and employment to estimate currency value.
Most active forex traders use both: technical analysis for entry timing and fundamental analysis to confirm the broader trend direction. A strong technical setup combined with a positive fundamental outlook increases the probability of a successful trade.
Which technical analysis strategy is best for beginners?
Trend trading is often considered the most beginner-friendly strategy because it uses simple, intuitive signals (moving average crossovers) and suits longer timeframes (daily or weekly charts), reducing the need for constant monitoring. Scalping and counter-trend trading are more demanding and have higher failure rates. Beginners should practice any chosen strategy on a demo account for several weeks before risking capital.
Can I use technical analysis on crypto or commodity pairs as well as forex?
Yes. Technical analysis methods (moving averages, support/resistance, chart patterns, oscillators) apply to any market with price history: forex, commodities, crypto indices, and stocks. However, crypto markets are less mature and more volatile than forex, so technical signals may be less reliable. Test any strategy on a demo account first, regardless of the market.
How long should I backtest a strategy before trading it live?
Backtest on at least 1-3 years of historical data to capture different market conditions: trends, consolidations, and reversals. One year of data is the minimum; more is better. After backtesting, forward test on a demo account for 2-4 weeks in live market conditions. If results are consistent between backtest and demo trading, you can risk a small live account. Never skip the demo testing phase.
Why do technical analysis strategies fail even when backtesting looks profitable?
Backtesting results can be misleading due to curve-fitting (overfitting parameters to historical data), ignoring slippage and commissions, survivor bias, and the assumption that past market behaviour repeats. Live trading conditions include variable spreads, slippage, emotional pressure, and changing market structure. Always forward test on a demo account and start with small position sizes in live trading.
Does NextTrade Broker allow Expert Advisors and automated trading of technical analysis strategies?
Yes. NextTrade Broker explicitly allows Expert Advisors (EAs), which are automated trading programs that execute technical analysis strategies. Both MetaTrader 5 and TradeLocker platforms support EA deployment. Ensure your EA includes proper stop-losses, position sizing, and risk controls before running it live.
Next step
Technical analysis is a framework for identifying potential trade setups, not a guarantee of profit. Success depends on disciplined execution, proper risk management, and realistic expectations. Before trading with real capital, test your chosen strategy on a free NextTrade demo account in live market conditions.
If you want to learn more about the broader types of technical analysis tools and how to interpret them, see Forex Technical Analysis: Charts, Structure, Signals, Limits.
For a deeper comparison of different strategy types and how to choose among them, read Forex Trading Strategies: Types, Examples and Risks.
To understand how costs and spreads affect strategy profitability across account types, explore Best Forex Broker Features: What to Compare and Position sizing for forex trading: the math.
Once you're ready to open an account, ensure you understand Forex Risk Management: Position Sizing and Stop-Losses and have a written trading plan in place.
Risk Warning: CFDs are complex instruments and carry a high risk of losing money rapidly due to leverage. Retail accounts at NextTrade Broker have negative balance protection, meaning you cannot lose more than your initial deposit. However, you can lose your entire deposit. You shouldn't risk money you cannot afford to lose. Don't trade CFDs unless you understand the risks and have the financial resources to withstand potential losses.
General Information Disclosure: This article explains trading concepts and doesn't constitute investment advice. Past performance doesn't guarantee future results. All trading involves risk, including possible loss of capital. Information in this article is current as of 30 October 2026. Check the current product terms before opening or funding an account with any broker.
TagsTrading Educationtechnical analysis strategies forextrend trading forexrange tradingbreakout trading