
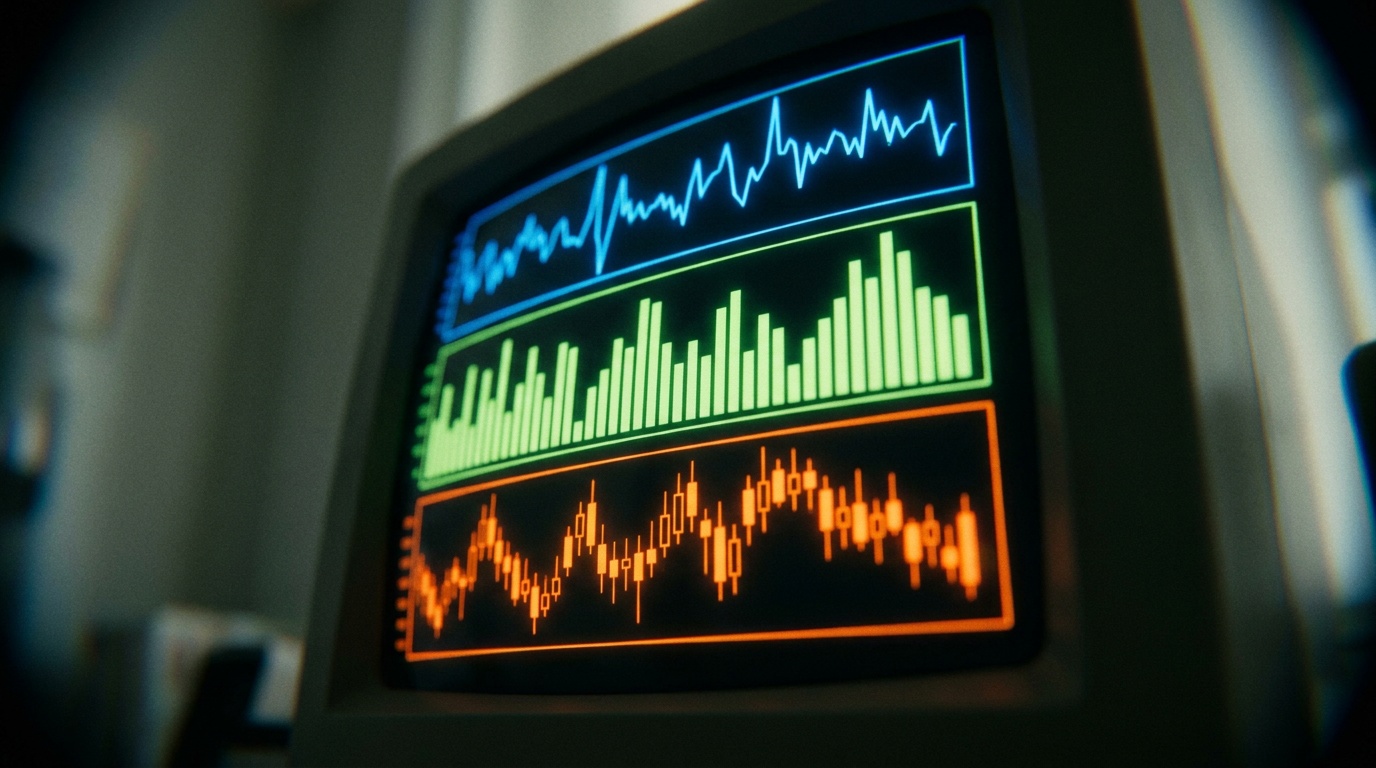
Forex charts display currency pair price movements over time. The timeframe you choose determines both the detail you see and the type of trading signals you can identify. The three main chart types are line charts (simplest, showing only closing prices), bar charts (displaying open, high, low, and close prices), and candlestick charts (the most widely used, offering visual clarity on price action). Choosing your timeframe depends on your trading style: short-term traders typically use 1-minute to 30-minute charts, swing traders favour 4-hour or hourly charts, and position traders rely on daily, weekly, or monthly views. Many experienced traders use multiple timeframes together to confirm signals and reduce noise.
This article explains how to read forex charts, interpret timeframes, and understand the trade-offs between detail and reliability. It's written for active and aspiring retail traders who need to understand how charts work before building a trading plan.
Quick answer: Choosing your chart type and timeframe
Candlestick charts are the most popular choice among forex traders. They clearly display open, high, low, and close prices for each period, and their colour instantly shows whether price closed higher or lower than it opened.
Your timeframe selection depends on how long you want to hold trades. Scalpers and day traders use short timeframes (1-minute, 5-minute, 15-minute, 30-minute) to catch quick price moves. Swing traders use 4-hour or hourly charts to capture trends over several days. Position traders use daily, weekly, or monthly charts to follow longer trends. The fundamental trade-off is between detail and noise: shorter timeframes offer more granular information but contain more random price fluctuation, while longer timeframes filter out short-term noise but may obscure quick trading opportunities.
What the term means: Forex charts and timeframes defined
A forex chart is a graphical representation of a currency pair's price movement over time. It plots price action (the movement of the currency pair's price), which forms patterns and trends that traders analyse to inform decisions.
Charts display price data using three standard formats. A line chart is the simplest type, connecting consecutive closing prices with a single line. It offers a general overview of price trends but lacks detail on price movements within each period.
A bar chart (OHLC) shows the open, high, low, and close prices for each period using a vertical line with two horizontal dashes. The vertical line represents the high and low range, the left dash marks the opening price, and the right dash marks the closing price.
A candlestick chart originates from Japanese price analysis and is the most widely used format among forex traders. Each candlestick has a rectangular body (showing the range between open and close prices) and thin extensions called wicks or shadows (showing the high and low prices for the period). A bullish candlestick (typically green or white) closes higher than it opens. A bearish candlestick (typically red or black) closes lower than it opens.
A timeframe is the duration each data point represents on a chart. Common forex timeframes range from 1-minute (the shortest, capturing single minutes of trading) to monthly (the longest, summarising a full month's activity). Intermediate timeframes include 5-minute, 15-minute, 30-minute, 1-hour, and 4-hour charts.
How it works: Reading charts and selecting timeframes
Understanding chart types and what they show
Each chart type displays the same price data but in different formats. The choice between them is largely visual and personal preference, though candlestick charts dominate in practice because their colour and shape communicate market sentiment quickly.
A single candlestick encodes four pieces of information: the opening price (where trading began during that period), the closing price (where it ended), and the highest and lowest prices traded. If a candlestick is bullish (green), the body spans from open to close (close being higher), and the wicks show how far price moved beyond those levels. If bearish (red), the same logic applies in reverse.
Bar charts convey identical information but use vertical lines and horizontal ticks instead of filled rectangles. Line charts discard intra-period detail entirely, showing only where each period closed.
Line charts are useful for a quick overview of general trend direction. They offer minimal insight into price volatility or market sentiment within each period.
Selecting a timeframe based on trading style
Your timeframe choice aligns with how long you intend to hold positions.
Short-term traders (scalpers and day traders) operate on 1-minute, 5-minute, 15-minute, and 30-minute timeframes. These shorter periods reveal more trading signals and price movements, allowing multiple trades within a single day. The trade-off is higher volatility and more "noise" (random price fluctuations that don't reflect the broader trend). These timeframes are most useful when you can monitor positions actively throughout the trading session.
Medium-term traders (swing traders) typically use 1-hour and 4-hour charts to capture trends unfolding over several days or weeks. These timeframes filter out much of the short-term noise while still providing sufficient detail for identifying entry and exit points. They suit traders who can't monitor charts constantly but want to hold positions beyond a single session.
Long-term traders (position traders) analyse daily, weekly, and monthly charts to identify overarching trends and hold positions for weeks, months, or even years. These timeframes show the broader market perspective and are less affected by minor price fluctuations. They're suited to traders building portfolios based on macroeconomic trends or long-term directional views.
Multi-timeframe analysis
Experienced traders often use multiple timeframes simultaneously to gain a comprehensive market view and confirm trading signals.
For example, a trader might identify a long-term uptrend on a daily chart, then use a 4-hour chart to spot shorter-term corrections within that larger movement, and finally a 15-minute chart to time precise entry and exit points. This layered approach reduces the risk of trading against the prevailing direction and helps distinguish genuine signals from random price noise.
When you compare the same currency pair across different timeframes, a pattern visible on a shorter timeframe may be only a small part of a larger, different pattern on a longer timeframe. This multi-timeframe perspective is critical to avoiding trades that align with short-term patterns but conflict with the bigger trend.
Worked example: Applying chart types and timeframes to a trade plan
This example is hypothetical and educational. It's not a recommendation to place any trade.
Assume a trader is analysing the EUR/USD currency pair and wants to identify a potential swing trade (holding for several days).
Step 1: Identify the broader trend on a daily chart. The trader plots EUR/USD on a daily candlestick chart and observes that closing prices have been rising over the past two weeks, with each peak higher than the previous one. This suggests an uptrend. The body colours (mostly bullish green candlesticks) and the pattern of higher highs support this view.
Step 2: Confirm the trend on a 4-hour chart. The trader then switches to a 4-hour candlestick chart of the same pair. Within the daily uptrend, the 4-hour chart shows several smaller pullbacks (temporary declines) interrupted by higher closings. These pullbacks represent short-term corrections within the larger upward move.
Step 3: Identify entry timing on a 15-minute chart. The trader zooms to a 15-minute chart. During one of the 4-hour pullbacks identified in Step 2, the 15-minute chart shows a brief dip in price. The trader notes where support (a price level where buying interest historically emerges) has held on the 15-minute timeframe. This is a potential entry point.
Step 4: Assess costs and risk. Before placing a trade, the trader considers the spread (the difference between bid and ask price), any applicable commission, and the position size relative to account risk. The cost to enter EUR/USD, hold for a few days, and exit includes the spread on entry and exit, any overnight financing charges, and any commission structure applied by the broker.
Why multiple timeframes matter: By itself, the 15-minute chart pullback might appear as a strong signal. However, seen in isolation, it could be minor noise within a larger 4-hour correction, which in turn is just a healthy pullback within a daily uptrend. The multi-timeframe view prevents the trader from confusing short-term jitter with a genuine reversal.
Spreads from 0.0 pips across 130+ instruments. Open Account
Costs and practical constraints: Spreads, platform tools, and timeframe limitations
Using different chart types and timeframes involves no direct cost, but understanding their practical constraints is essential to realistic trading planning.
Spread and trading costs
Every trade entry and exit incurs a spread, the difference between the bid price (what buyers will pay) and the ask price (what sellers will accept). When you enter a trade on any timeframe, you pay the spread immediately. When you exit, you pay it again. Shorter timeframe trading requires more frequent entries and exits, which multiplies the total spread cost over time.
For example, if EUR/USD has a spread of 1.3 pips, a single round trip (entry and exit) costs 2.6 pips. A trader placing 20 trades per day on a 5-minute chart incurs 52 pips in spread costs before any profitable trades.
In contrast, a position trader placing two trades per month pays only 5.2 pips in spread costs over the same period. Raw and VIP accounts at NextTrade offer spreads from 0.0 pips plus commission, which can reduce this cost for active traders, though the trade-off is a minimum deposit and per-lot charges.
Platform capabilities and chart display
Modern trading platforms such as MetaTrader 5 and TradeLocker (which integrates TradingView charts) allow traders to switch between chart types and any timeframe from 1-minute to monthly with a single click. This accessibility means the practical constraint isn't availability but rather the trader's discipline and decision-making speed.
Switching between too many timeframes without a clear plan can lead to information overload and conflicting signals.
Timeframe-specific challenges
Shorter timeframes (1-minute to 30-minute): These show more trading opportunities but are heavily influenced by random price movement, order flow noise, and algorithmic trading activity. Patterns that appear clear on a 1-minute chart may dissolve when viewed on a 5-minute or 15-minute chart. Traders must tolerate higher false signal rates and frequent whipsaw (rapid reversals that trigger stops).
Longer timeframes (daily to monthly): These filter out noise and reveal the genuine long-term trend, but they obscure short-term entry and exit timing. A trader waiting for a daily chart signal might miss a multi-day price move entirely or have to accept a less-than-ideal entry price.
Risks and limitations: When charts mislead and timeframes fail
Charts represent past price action, not future outcomes
The most fundamental limitation of chart analysis is that past price patterns don't guarantee future behaviour. A support level (a price where buying has historically emerged) may hold dozens of times, then break suddenly. A candlestick pattern that has preceded rallies in the past may be followed by a decline the next time it appears.
Chart patterns provide probability estimates based on historical frequency, not certainties.
Indicator lag and real-time gaps
Many technical indicators are derived from past price action and inherently lag behind current market movements. A moving average, for instance, is calculated from historical closing prices and therefore always trails the current price.
In fast-moving markets, by the time a chart signal appears, price has already moved significantly from the entry level shown on the chart. Slippage (the difference between expected and actual fill price) can turn a profitable-looking signal into a loss.
Noise versus signal across timeframes
Shorter timeframes contain proportionally more noise. A 1-minute chart may show a bullish candlestick pattern that suggests a price rise, but that pattern may be reversed within minutes by algorithmic activity or a brief liquidity event. Traders fixating on short timeframes risk reacting to noise rather than trading genuine moves.
Conversely, focusing only on long timeframes means missing intra-trend opportunities and potentially staying in losing trades longer than necessary.
Confirmation bias and selective pattern recognition
Traders are prone to seeking patterns that confirm an existing bias. If a trader is bullish on EUR/USD, they may selectively notice candlestick patterns that suggest a rally while overlooking patterns that suggest caution.
Charts don't impose objectivity. They require it from the trader.
Timeframe mismatch and conflicting signals
If a long-term daily chart shows an uptrend but the 15-minute chart shows a break below a support level, which signal should you follow? Multi-timeframe analysis can create conflicting signals if the trader hasn't established a hierarchy of decision rules.
Without clarity on whether you're trading the daily trend or the 15-minute opportunity, conflicting signals lead to hesitation or contradictory trades.
Common misunderstandings: Chart myths and timeframe misconceptions
Misconception 1: Shorter timeframes offer more accurate signals
Some traders believe that watching a 1-minute chart provides more precise analysis than a daily chart.
In reality, shorter timeframes contain more noise and false signals. The higher frequency of trading signals on short timeframes isn't accuracy. It's volatility. A 1-minute chart may flash a buy signal every few seconds, but most are noise rather than high-probability setups.
Misconception 2: Candlestick patterns are predictive
A pattern such as a hammer candlestick or an engulfing pattern has a historical tendency to precede certain price movements. However, this doesn't mean the pattern predicts the next move. Each market situation is unique, influenced by news, economic data, and changing market structure. Using a pattern in isolation without considering the broader trend context leads to whipsaw losses.
Misconception 3: Longer timeframes guarantee stability
While longer timeframes filter out short-term noise, they don't guarantee profitable or stable outcomes. A daily chart uptrend can reverse sharply on a major economic news event or a shift in monetary policy. Longer timeframes are more stable visually, but price can still move against a trader's position rapidly.
Misconception 4: You should always use the longest timeframe available
Some traders assume daily or weekly charts are always superior. However, if your trading style requires exiting within hours, a daily chart won't provide the granularity needed for precise entry and exit timing. Timeframe selection should match your trading plan, not the perceived prestige of longer-term analysis.
Misconception 5: Multi-timeframe analysis eliminates losses
Analysing multiple timeframes improves decision-making by filtering out noise and confirming trends. However, it doesn't eliminate losses. Markets reverse, unexpected events occur, and even high-probability setups fail. Multi-timeframe analysis reduces whipsaw and false signals, but it doesn't guarantee profitability.
Practical checklist: Setting up chart analysis for your trading plan
Use this checklist to structure your approach to chart reading and timeframe selection:
- Define your trading style: Decide whether you're a scalper, day trader, swing trader, or position trader. This directly determines which timeframes you should use.
- Choose your primary timeframe: Select the timeframe that matches your intended holding period (e.g., 1-hour for day trades, 4-hour for swing trades).
- Select your chart type: Most traders use candlestick charts for their visual richness, but bar or line charts are also valid depending on your preference.
- Establish a multi-timeframe hierarchy (optional but recommended): If using multiple timeframes, clearly define which is your decision timeframe (e.g., daily for trend) and which is your execution timeframe (e.g., 15-minute for entry timing).
- Verify spread costs on your chosen timeframe: Calculate the impact of round-trip spread costs on your strategy. Frequent short-timeframe trading accumulates significant spread costs.
- Test your analysis on historical data: Before live trading, review past price action on your chosen timeframes to understand how reliably your signals have performed. Remember that past performance doesn't guarantee future results.
- Set clear entry and exit rules: Define in advance where you'll enter, where you'll exit profitably, and where you'll cut losses. Avoid changing these rules mid-trade based on emotional reaction to short-term price noise.
- Use a demo account first: Practice reading charts and executing trades on a demo account before risking real capital. This builds confidence and reveals weaknesses in your chart-reading approach without financial consequence.
Frequently asked questions
What chart type should I use if I'm new to forex trading?
Start with candlestick charts on an hourly or 4-hour timeframe. Candlesticks provide clear visual information about price action without overwhelming detail, and these timeframes filter out short-term noise while remaining responsive to genuine market moves. Once comfortable with candlestick interpretation, experiment with different timeframes to match your trading style.
Can I use line charts for forex trading?
Yes, but with limitations. Line charts are useful for quickly identifying overall trend direction and major reversals, but they hide intra-period volatility and provide no information about market sentiment within each period.
Most active traders use candlestick or bar charts because they reveal more price action detail. Line charts work best as a first step to understand the broad trend before zooming into candlestick or bar charts for precise entry and exit timing.
How many timeframes should I analyse before placing a trade?
There's no fixed number, but most traders use between two and three. Analysing too many timeframes creates conflicting signals and decision paralysis. A common approach is to use a primary timeframe (daily for position traders, 4-hour for swing traders) to identify the trend, then a shorter timeframe (4-hour or 1-hour for swing traders, 15-minute for day traders) to identify entry and exit points. Adding a third timeframe for fine-tuning is optional.
Does a higher spread on longer timeframes affect my trading costs?
Spread is charged per round trip regardless of timeframe. If EUR/USD has a spread of 1.3 pips, you pay 2.6 pips for a complete entry and exit trade, whether you hold for 1 minute or 1 month.
However, longer timeframe traders place fewer trades overall, so their total spread cost over time is lower than short-term traders who accumulate spread costs across many more trades.
What is the best timeframe for swing trading?
Swing traders typically use 4-hour or 1-hour charts because these timeframes capture trends unfolding over several days without requiring constant monitoring. A 4-hour chart offers less short-term noise than a 1-hour chart, making signals clearer, while a 1-hour chart provides more precise entry and exit timing. Many swing traders use a daily chart to confirm the broader trend, then a 4-hour chart for trade execution.
If a signal fails on a 15-minute chart, does that mean it will also fail on a 4-hour chart?
Not necessarily. A 15-minute chart signal might be reversed by short-term noise unrelated to the broader 4-hour trend. Conversely, a 4-hour signal might fail if the daily trend reverses.
This is why multi-timeframe analysis matters: it prevents you from over-weighting short-term noise. A 15-minute signal aligned with a 4-hour uptrend and a daily uptrend is more robust than a 15-minute signal in isolation.
Next step: Building your chart analysis into a complete trading plan
Now that you understand how forex charts work and how to select timeframes, the next step is to integrate chart analysis into a broader trading strategy. Chart reading is a foundation skill, but it must be combined with understanding market structure, price patterns, and risk management.
Consider reviewing Forex Technical Analysis: Charts, Structure, Signals, Limits to learn how chart patterns fit within the wider context of technical analysis. For guidance on applying timeframes within a specific trading strategy, see Technical Analysis Strategies in Forex Trading.
Once you have a chart-based strategy, you'll need to manage risk carefully. Forex Risk Management: Position Sizing and Stop-Losses explains how to size positions relative to your account and set stop-loss levels based on the timeframe and chart patterns you identify.
Finally, to execute your strategy, you need a platform that displays multiple chart types and timeframes clearly and allows quick switching between them. MetaTrader 5 and TradeLocker.One account, one price. both support full candlestick, bar, and line chart functionality across all standard timeframes from 1-minute to monthly, allowing you to practise multi-timeframe analysis without software constraints.
You can learn more about how technical analysis concepts fit together in the hub article Forex Technical Analysis: Charts, Structure, Signals, Limits, or explore specific strategies that use chart timeframes effectively in Forex Trading Strategies: Types, Examples and Risks.
If you're ready to apply chart analysis with real market data, open a free demo account to practise reading charts, test different timeframes, and build confidence in your analysis before trading with real capital.
Risk Warning: CFDs are complex instruments and come with a high risk of losing money rapidly due to leverage. Retail client accounts with this provider lose money when trading CFDs. You should consider whether you understand how CFDs work and whether you can afford to take the high risk of losing your money. Past performance does not indicate future results. Historical data and performance are not guarantees of future performance. Information provided here may have changed since the last update.
TagsTrading Educationhow to read forex chartsforex chart typesforex timeframescandlestick charts forex