
Forex Trading Strategies: Types, Examples and Risks
Published Updated
By NextTrade Editorial

Forex trading strategies are defined plans used to determine when to buy or sell currency pairs, including entry and exit points, risk management rules, and position sizing. Different strategies operate across different timeframes and use different analytical approaches. Some rely on price charts and technical patterns, others on economic data and news events, and still others on automated algorithms. Understanding the core types, how they function, and their real costs and risks is essential before committing capital.
This guide explains the main strategy categories, how each works in practice, the costs involved, and the limitations traders face when implementing them. It's written for active and aspiring retail traders who need to understand trading mechanics rather than encouragement to deposit funds.
Quick answer: What a forex trading strategy is
A forex trading strategy is a repeatable, rule-based plan that specifies when to enter and exit trades, how much capital to risk per trade, and how to manage positions. Strategies vary by analytical method, technical analysis of price charts, fundamental analysis of economic data, or both, by timeframe (scalping seconds, day trading hours, swing trading days, or position trading months to years), and by execution method (manual or algorithmic). No single strategy works in all market conditions. Past performance doesn't guarantee future results.
What the term means: Core definitions
Forex Trading Strategy is a documented method for decision-making in currency markets. It includes entry rules (when to open a position), exit rules (when to close profitably or at a loss), position sizing (how much capital to allocate), and risk management rules (stop-loss placement, maximum loss per trade).
Technical Analysis is the study of historical price charts, candlestick patterns, and indicators like moving averages, the Relative Strength Index (RSI), and Bollinger Bands to identify trends and predict future price movements.
Fundamental Analysis is the assessment of economic data, interest rates, employment figures, GDP growth, alongside news events and geopolitical factors to evaluate currency value and anticipate price direction.
Algorithmic (Automated) Trading executes trades using pre-programmed computer code that automatically enters and exits positions based on defined criteria, without human intervention during execution. Manual trading is execution by a trader based on their own analysis and real-time decision-making.
Timeframes describe the period over which a trader analyzes price charts and holds positions:
- Scalping: Seconds to minutes; very high trade frequency; requires very low costs and fast execution.
- Day Trading: Hours within a single day; multiple trades; positions closed before market close.
- Swing Trading: Days to weeks; medium trade frequency; captures multi-day price moves.
- Position Trading: Weeks to years; low frequency; focuses on long-term trends and macroeconomic factors.
Entry and Exit Points are specific price levels at which a trader opens or closes a position. Entry rules might specify "buy when price crosses above a 50-day moving average." Exit rules might say "close the position if price falls 2% below entry" (stop-loss) or "close if price rises 5% above entry" (take-profit).
Stop-Loss Order is an instruction to sell an asset if it reaches a predetermined price below entry, designed to limit losses. Take-Profit Order closes a profitable position at a preset price above entry.
Risk-Reward Ratio is the potential profit divided by the amount at risk. A 1:3 ratio means risking one unit of capital for three units of potential profit.
Position Sizing is the calculation of how much capital to allocate to a single trade, typically based on risk tolerance and account size. Proper position sizing prevents any single trade from decimating the account.
Backtesting is testing a strategy using historical price data to see how it would have performed in the past. Forward Testing (Paper Trading) applies the strategy in real-time using simulated money before committing real capital.
How it works: The core strategy types
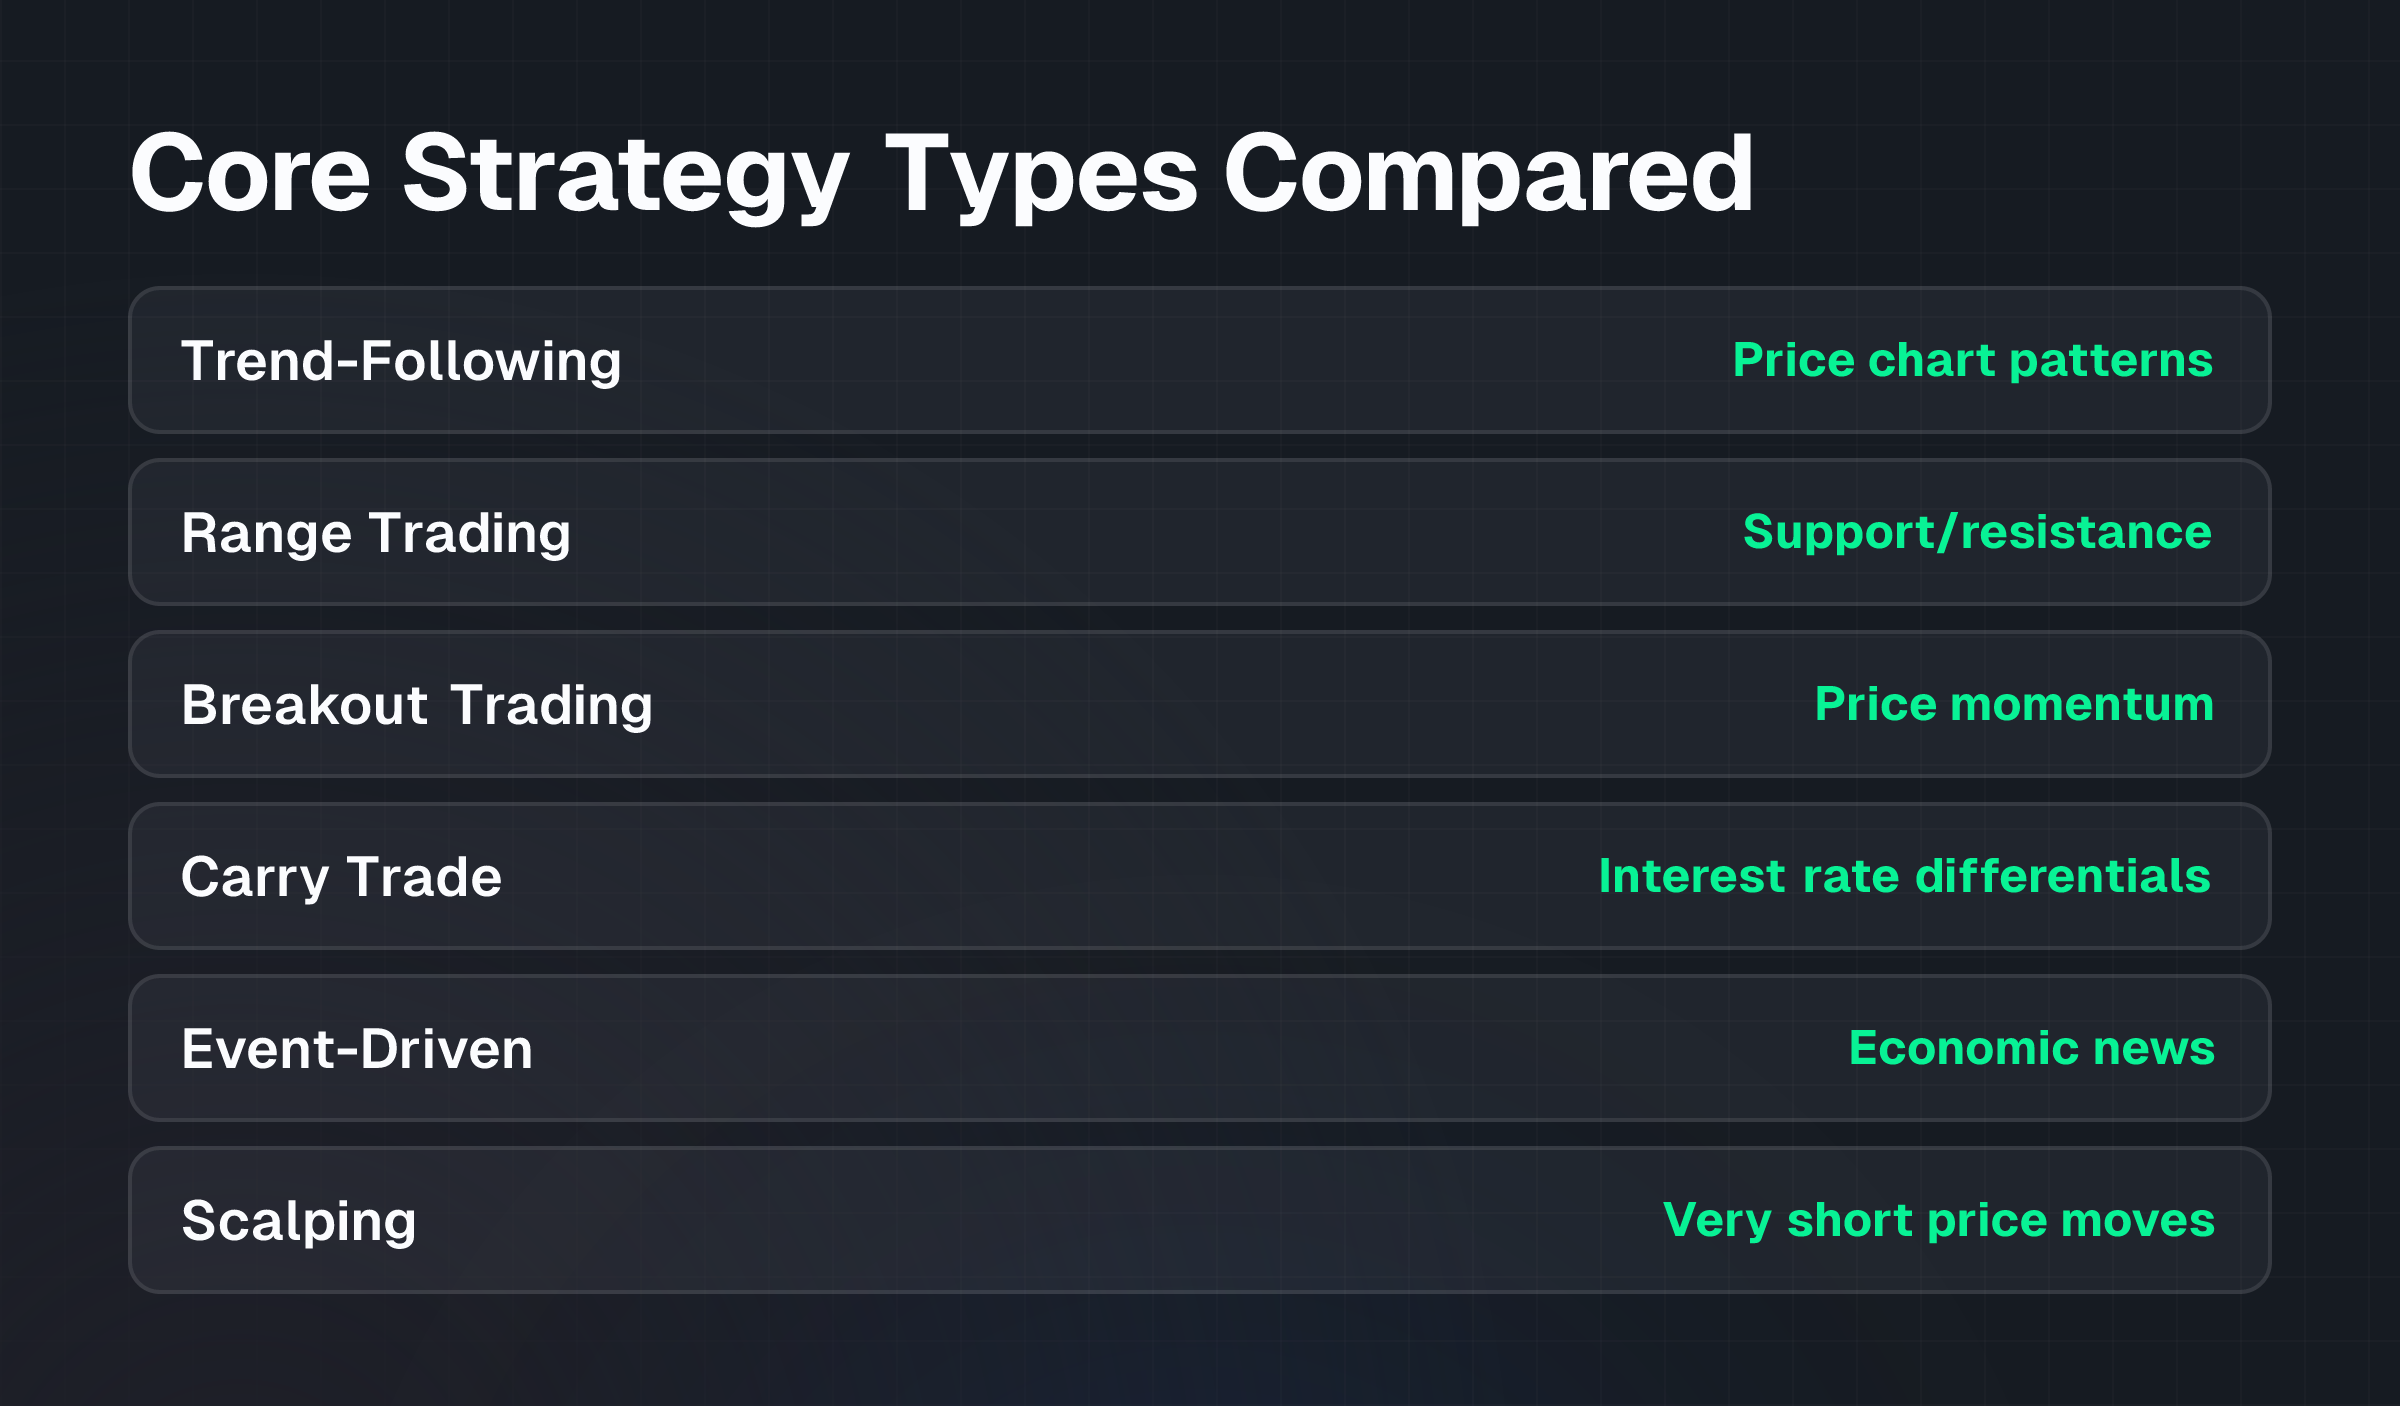
Forex trading strategies fall into several broad categories. Each operates under different assumptions and works better in different market conditions.
Trend-Following Strategies
Trend-following strategies aim to profit from established market trends by entering in the direction of the trend and holding until the trend reverses.
A trader identifies whether a currency pair is in an uptrend (prices rising) or downtrend (prices falling), then enters buy trades during uptrends and sell trades during downtrends. Academic research supports the historical effectiveness of trend-following across asset classes, including currencies. A study published in the Journal of Financial Economics by Moskowitz, Ooi, and Pedersen (2012) titled "Time Series Momentum" found that trend-following strategies have historically generated significant returns across various asset classes, though they also experience extended periods of underperformance.
A common implementation uses moving averages: buy when the current price is above a long-term moving average (the 200-day average, for instance), sell when it falls below. This approach captures longer-term moves but generates fewer trades and misses short-term reversals.
Range Trading (Mean Reversion)
Range trading operates on the assumption that prices tend to revert to their average after extreme movements.
Traders identify a trading range, a price band where the currency pair oscillates between support (lower boundary) and resistance (upper boundary), then buy near support and sell near resistance. Research by Lo and MacKinlay (1988) in "Stock Market Prices Do Not Follow Random Walks: Evidence from a Simple Specification Test" (published in The Review of Financial Studies) explored mean reversion tendencies in financial markets, providing theoretical grounding for range strategies.
Common tools include Bollinger Bands, which mark overbought and oversold levels, and the Relative Strength Index (RSI). RSI signals extreme readings above 70 (overbought) and below 30 (oversold). A trader might sell when RSI exceeds 70, betting on a pullback toward the mean.
Breakout Trading
Breakout trading profits from significant price movements that occur when a currency pair breaks through a defined trading range or key support/resistance level.
The strategy assumes that once a price breaks a significant barrier, momentum continues in that direction. Quantitative analyst Nick Chan, in "Quantitative Trading: How to Build Your Own Algorithmic Trading Business" (2013), discusses breakout strategies and notes that false breakouts, where price briefly exits a range then reverses, are a major challenge.
Example: A trader observes that EUR/USD has traded between 1.0850 and 1.0950 for two weeks. When price breaks above 1.0950 on high trading volume, the trader enters a buy trade, expecting further upward movement.
Carry Trade
The carry trade involves borrowing a currency with a low interest rate and investing in a currency with a higher interest rate. The profit comes from the interest rate differential (the "carry").
A trader holds the position for days or weeks to accumulate interest payments. Burnside, Eichenbaum, Kleshchelski, and Rebelo (2006) analyzed carry trade profitability in "The Returns to Currency Speculation" (NBER Working Paper 12282). They found that carry trades can generate profits but face significant crash risk, particularly during market stress or rapid interest rate changes.
Example: If Australia's interest rate is 4% and Japan's is 0.5%, a trader buying AUD/JPY earns the 3.5% differential annually (minus financing costs). This works until a sudden shift in monetary policy or market crisis causes rapid currency depreciation, wiping out accumulated interest gains and more.
Event-Driven Trading (News Trading)
Event-driven strategies react to significant economic news releases or geopolitical events expected to cause sharp price movements.
A trader might trade around central bank announcements, employment reports (Non-Farm Payrolls in the US, for instance), or geopolitical crises. Andersen, Bollerslev, Diebold, and Vega (2003) in "Microstructure of Foreign Exchange Markets" (published in Journal of Financial Economics) show that macroeconomic news announcements drive immediate, substantial volatility in exchange rates. Predicting the direction and magnitude of moves remains challenging, though.
Timeframe-Specific Approaches
Scalping executes many very short-term trades, seconds to minutes, to capture tiny price moves of 2-5 pips. Scalpers require extremely low spreads, fast order execution, and intense screen time. It's suitable for traders with high risk tolerance and access to low-cost platforms.
Day Trading opens and closes all positions within a single trading day, avoiding overnight risk and interest charges. It requires dedicated time during market hours and discipline to exit all trades before close.
Swing Trading holds positions for days to weeks, capturing multi-day price swings of 100-200 pips or more. It requires less screen time than day trading but still demands regular monitoring and news awareness.
Position Trading holds positions for weeks, months, or years, focusing on long-term trends and macroeconomic fundamentals. It suits traders with patience and conviction in longer-term economic outlooks; it requires minimal daily attention but larger account cushion to absorb drawdowns.
Worked example: Building and testing a simple trend-following strategy
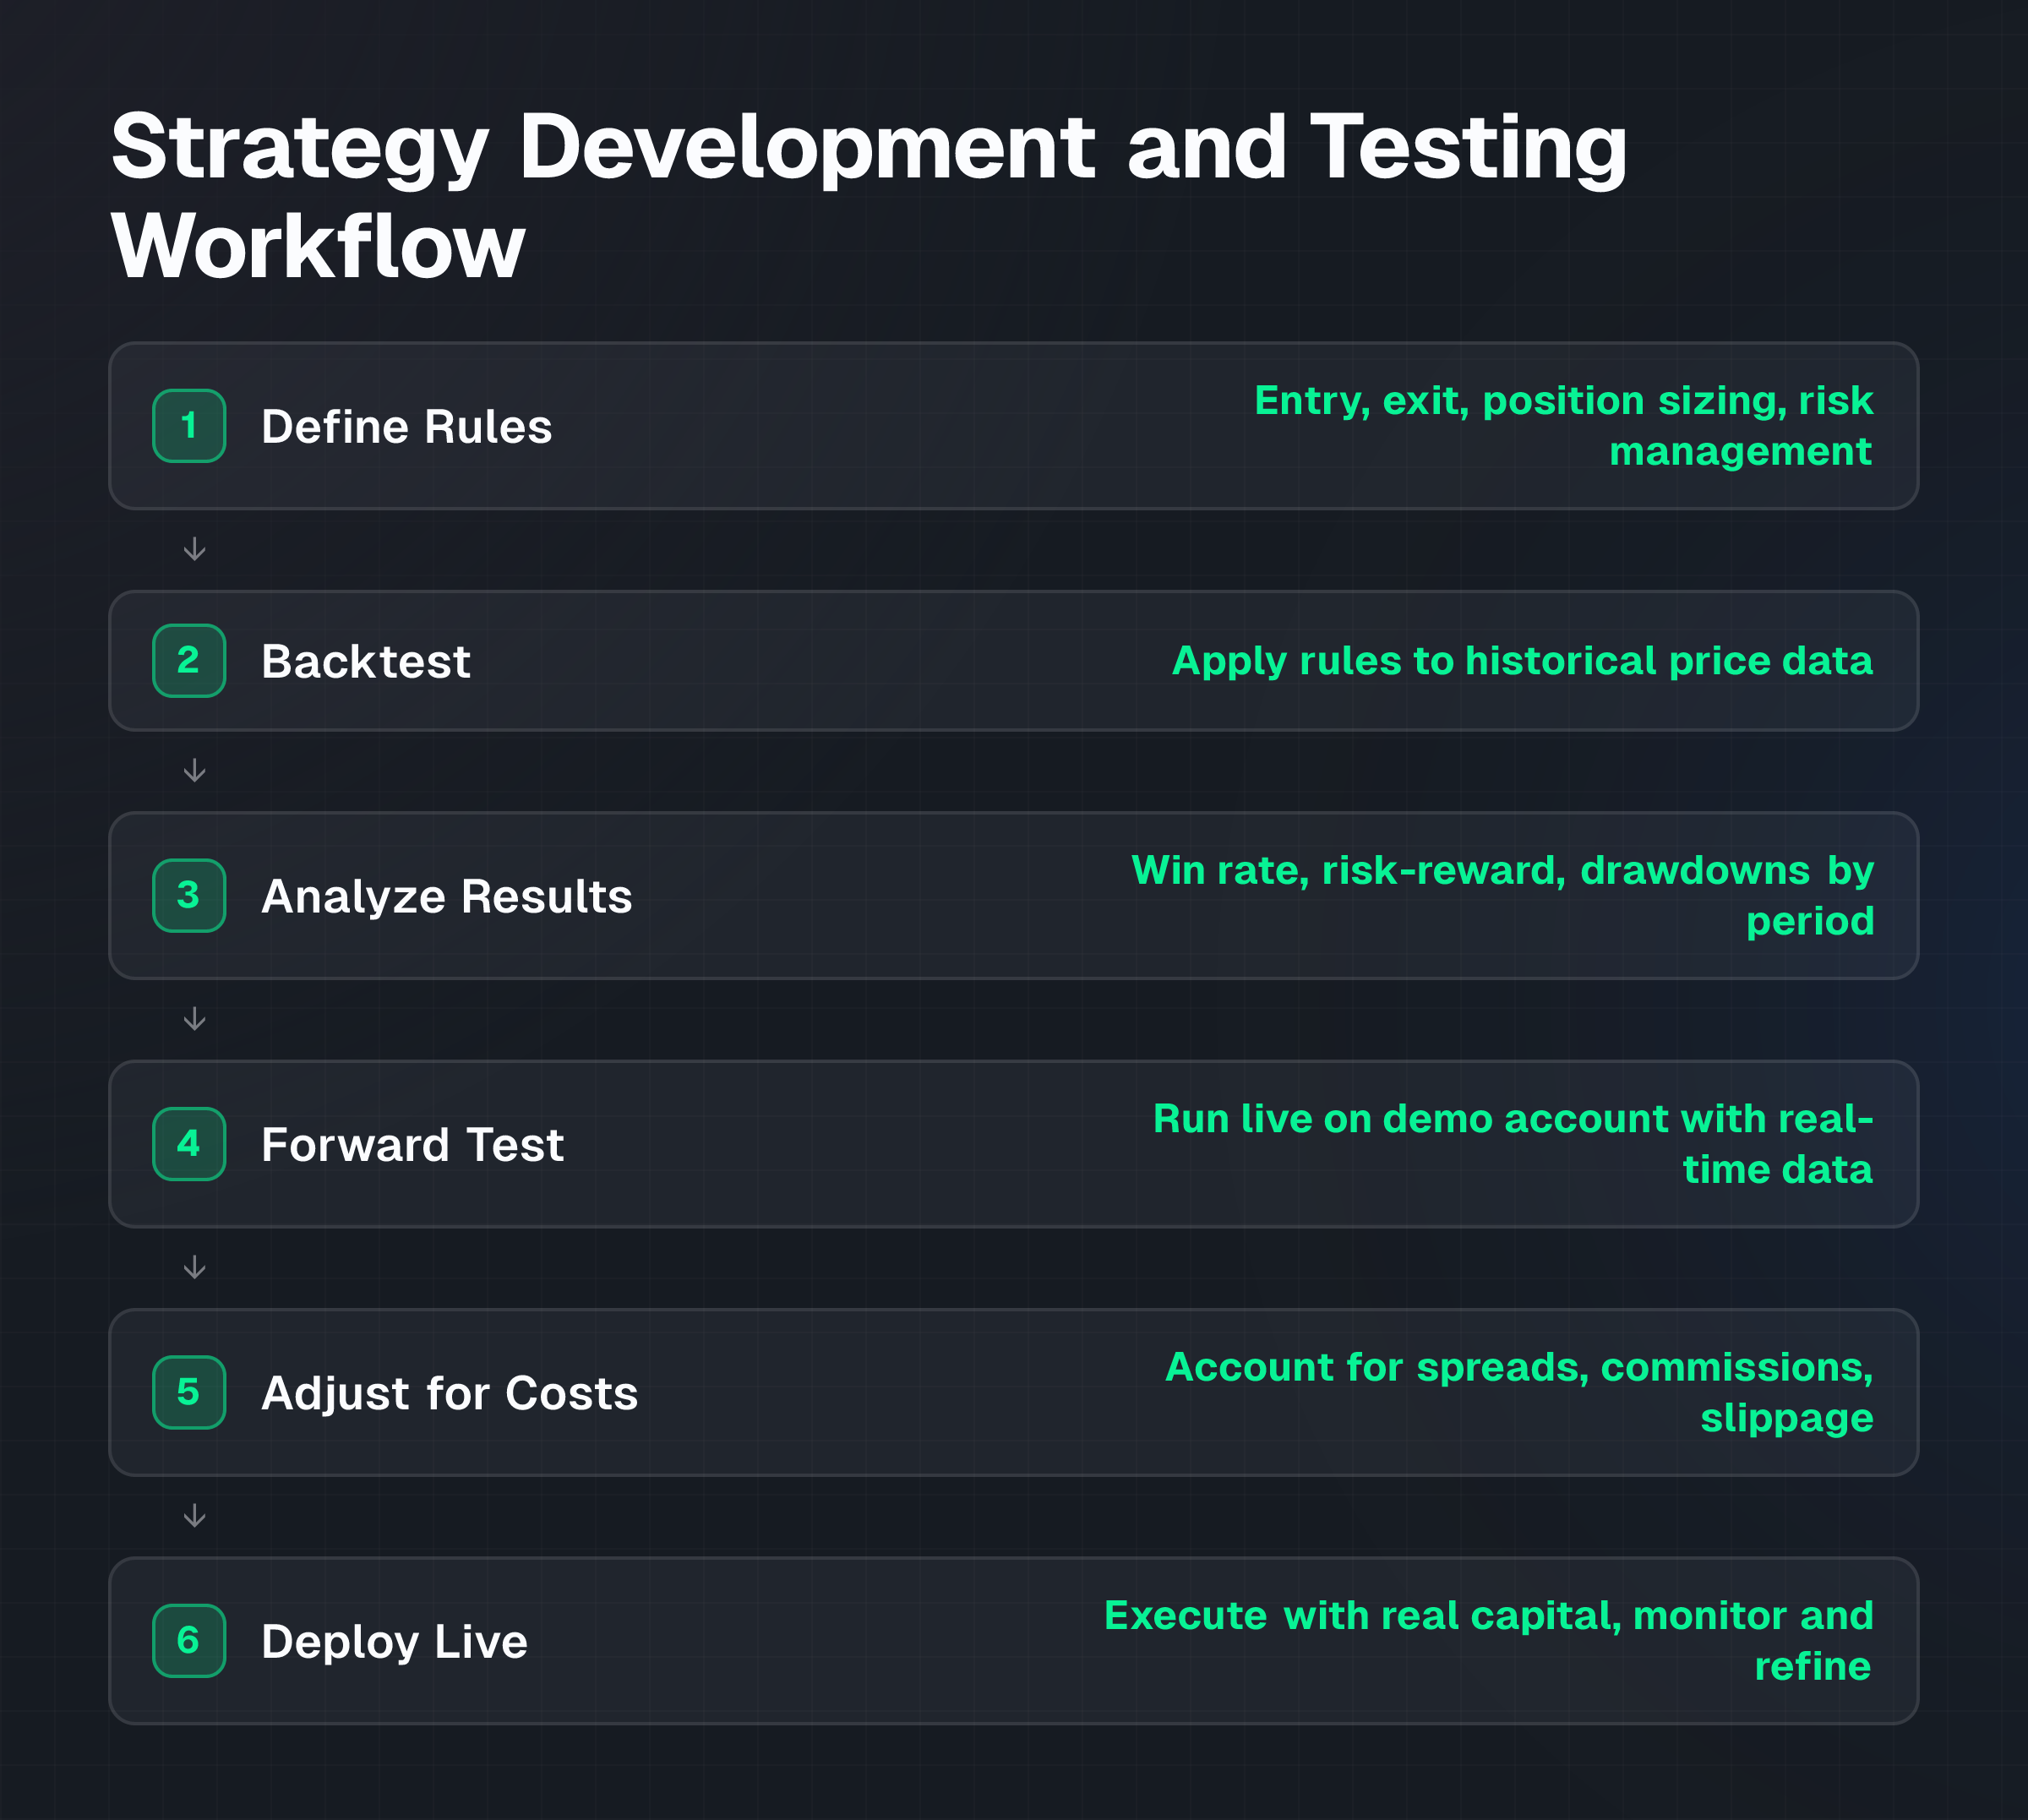
This example illustrates how a trader might construct and test a basic strategy. It's hypothetical and educational, not a recommendation to trade.
Strategy Definition:
- Entry Rule: Buy EUR/USD when the 20-day moving average crosses above the 50-day moving average; sell when the 20-day crosses below.
- Exit Rules: Close with a stop-loss if price falls 2% below entry; close with a take-profit if price rises 4% above entry.
- Position Size: Risk 1% of account equity per trade (if account is $10,000, risk $100 per trade).
- Timeframe: Swing trading (hold days to weeks).
Backtesting: The trader applies this rule set to EUR/USD daily data for the past five years, using backtesting software. Results show:
- Win rate: 52% (52 winners, 48 losers)
- Average win: +4% (meets the take-profit target)
- Average loss: -2% (hits the stop-loss)
- Risk-reward ratio per trade: 1:2 (risking 1% to earn 2%)
Over 100 trades, the strategy would have yielded approximately 200 pips of net profit (hypothetically), but performance varied significantly by year; some years showed +15% gain, others -8%.
Forward Testing: The trader then applies the same rules live on a demo account for two weeks, using real-time price data, to confirm that the rules execute as intended without slippage, technical errors, or emotional deviation.
Assumptions in this example:
- No slippage (actual exit prices match targets exactly).
- No commission or spread costs; in reality, spreads and commissions reduce profitability.
- Market conditions remain consistent; they don't.
- Past data is representative of future data; it often isn't.
This example demonstrates the process, not the probability of profit.
Costs and practical constraints: Real-world expenses and limitations
Forex trading strategies incur costs that directly reduce profitability. Understanding these costs is essential to strategy design.
Transaction Costs
Spreads are the difference between the bid and ask price, what a trader pays to enter a position. A spread of 2 pips on EUR/USD means the trader loses 2 pips the moment a position opens.
Commission is a direct fee charged per trade or per lot. Some brokers charge no commission but widen spreads; others offer tight spreads but charge per trade.
Slippage occurs when an order executes at a different price than intended, usually due to rapid market movement or liquidity gaps. A trader submitting a market order during high volatility may receive a worse price than the quoted price, resulting in immediate loss.
Overnight Financing (Swap Costs) applies when a position is held past the end of the trading day. The cost depends on the interest rate differential between the two currencies and the direction of the trade.
High-frequency strategies like scalping are especially sensitive to these costs. A scalper targeting 3-pip moves incurs 2 pips of cost (spread) and 0.5 pips of slippage, leaving only 0.5 pips of profit, a razor-thin margin with no room for error.
Platform and Data Requirements
Live price data, charting tools, and algorithmic execution platforms all carry costs.
Some brokers offer free platforms; others charge monthly subscriptions. Automated strategies require either a broker that supports custom algorithms or third-party tools to connect trading logic to the broker's API.
Time Investment
Manual trading strategies, day trading, swing trading, demand significant daily time. A trader must monitor charts, news, and market hours.
Event-driven strategies require alertness around announcement times. Position trading demands less time but requires patience and conviction to hold through drawdowns.
Market Liquidity and Timeframe Constraints
Strategies designed for low-liquidity pairs or exotic currency crosses often encounter wider spreads and slippage than major pairs like EUR/USD.
News-driven strategies may fail during thin-liquidity periods. Scalping on weekends is impossible due to market closure.
Risks and limitations: Why strategies fail
No strategy guarantees profit. Understanding the real risks is critical.
Strategy Doesn't Account for All Market Conditions
A strategy that works in trending markets often fails in choppy, sideways markets.
A range-trading strategy produces losses when the price suddenly breaks out. Past performance doesn't predict future results; market conditions shift, and data regimes change.
Curve-Fitting and Over-Optimization
Traders can inadvertently design a strategy that performs exceptionally on historical data but fails in live trading.
By fine-tuning parameters, moving average lengths, RSI thresholds, to fit past data precisely, the trader creates a system that reacts to noise rather than genuine patterns. This is called "overfitting." A strategy that worked perfectly on 2018-2023 data may fail entirely in 2024.
Leverage Amplifies Both Gains and Losses
Leverage increases market exposure: a trader using 1:100 leverage controls 100 times the capital they deposited.
This magnifies both gains and losses. A 1% adverse move against a leveraged position can wipe out a significant portion of the account. Leverage up to 1:1000 is available through some platforms, but using the full amount without strict risk controls invites catastrophic loss.
Emotional Deviation from Rules
Even the best strategy fails if the trader abandons the rules under pressure.
Fear causes premature exit at losses; greed causes holding winners too long or adding to losing trades. Discipline is essential. Emotion is the enemy of strategy.
Slippage and Execution Risk During High Volatility
Stop-loss orders are meant to limit losses, but during rapid price moves, execution may occur far below the stop price.
A trader setting a stop-loss 2% below entry may see it execute at 5% below during a flash crash or major news event. This gap is called "slippage."
Insufficient Position Sizing
A trader who risks too much per trade can suffer severe drawdowns or total account loss after a string of losses.
A trader who risks too little never builds capital. Proper position sizing, typically 1-2% of account equity per trade, balances these concerns.
Geopolitical or Macroeconomic Shock
A sudden central bank policy shift, geopolitical crisis, or black-swan event can break a working strategy overnight.
No backtested system accounted for the 2020 COVID-19 crash or 2022 energy crisis.
Common misunderstandings: What traders often get wrong
"My strategy worked on backtesting, so it'll work live."
Backtesting uses historical data. Live markets include new conditions, wider spreads, slippage, and emotional pressure. A strategy profitable on historical data may fail under live conditions.
"Higher win rate means better profit."
A strategy with 80% win rate but small wins and occasional large losses may underperform a strategy with 50% win rate but consistent 1:2 risk-reward. The size and consistency of wins and losses matter more than frequency.
"I can avoid losses by trading only after major news."
News events create sharp moves, but they're also unpredictable in direction and magnitude. Many news traders enter at the worst moments, chasing moves already in progress.
"Leverage increases my profit potential without changing risk."
Leverage does increase profit potential, but it also scales losses at the same rate. A 1% adverse move on 1:100 leverage causes a 100% loss on that portion of capital. Risk isn't optional.
"If I optimize my strategy more, it'll become more profitable."
Over-optimization to past data often reduces live performance. A strategy tuned to fit every wiggle in historical data becomes fragile and breaks in new conditions.
Practical checklist: Steps to develop and test a strategy
Before trading with real capital, work through this process:
- Define Your Trading Style and Goals
How much time can you dedicate daily? Scalping requires constant attention; position trading doesn't. What's your risk tolerance? Can you accept a 20% drawdown? 50%? How much capital do you have to start? Minimum determines leverage feasibility. What's your profit target? Realistic targets prevent overtrading.
- Choose an Analytical Approach
Will your strategy rely on price charts (technical analysis), economic data (fundamental analysis), or both? Which indicators or patterns will you use to identify entries and exits? Will you trade manually or automate?
- Select a Strategy Type
Choose one: trend-following, range trading, breakout, carry, news-driven, or timeframe-specific. Ensure the choice aligns with your time availability and analytical preference.
- Develop a Written Trading Plan
Document entry rules (specific, quantifiable conditions). Document exit rules (stop-loss level, take-profit level, or trailing stop). Specify position size (% of account equity at risk per trade). Set maximum loss per day or week.
- Backtest the Strategy
Apply the rules to at least three to five years of historical price data. Record win rate, average win, average loss, and total profit/loss. Test on multiple currency pairs and different market environments if possible. Look for consistency; inconsistent results suggest the strategy may not be robust.
- Forward Test (Paper Trade)
Apply the rules in real-time using a demo or practice account. Use real-time data and execute trades as the rules specify. Run for at least two to four weeks to observe real execution, slippage, and emotional response. Track results; verify they match backtesting expectations reasonably.
- Start Small and Monitor
If forward testing is successful, begin live trading with a small account or tiny position sizes. Track every trade; measure win rate, risk-reward, and cumulative profit/loss. Allow at least 20-30 trades before deciding whether to scale up or revise the strategy.
- Review and Adjust (Without Over-Optimizing)
After 30 trades, review performance. Did it match expectations? If performance is significantly worse than backtesting, investigate whether market conditions changed or whether the strategy needs adjustment. Avoid changing rules after each loss; wait for statistically meaningful sample sizes.
Frequently asked questions
What is the difference between technical and fundamental analysis?
Technical analysis uses historical price charts, candlestick patterns, and indicators (like moving averages and RSI) to predict future price movements.
Fundamental analysis examines economic data (interest rates, employment), news events, and geopolitical factors to assess currency value. Technical traders focus on "how price moves;" fundamental traders focus on "why currencies should move." Many traders use both.
Can automated strategies outperform manual trading?
Automated strategies can execute rules consistently without emotion and 24 hours per day if programmed into a bot.
Automation doesn't guarantee better results, though; it only ensures discipline. A poorly designed automated strategy will fail just as readily as a poorly designed manual one. Automated strategies are allowed on platforms supporting custom Expert Advisors or APIs.
How much capital should I start with?
Minimum depends on your broker and strategy. Many brokers accept starting deposits of $50 to $100.
Starting capital also affects position sizing and risk management. Smaller accounts can use high leverage to control larger positions but face higher risk of margin calls. A minimum of $1,000 allows reasonable position sizing without extreme leverage. See the guide to position sizing for detailed calculations.
What is a reasonable win rate for a profitable trading strategy?
Win rate alone doesn't determine profitability; the size of wins versus losses matters more.
A 40% win rate with 1:3 risk-reward (risking 1 to earn 3) generates profit. A 60% win rate with poor 1:1 risk-reward may not. Focus on risk-reward ratio, consistency, and cumulative outcome rather than win percentage.
How long should I backtest before committing real capital?
Backtest at least three to five years of historical data, covering multiple market regimes (trending, ranging, volatile, calm).
Longer is better, but more than 10 years may include regimes no longer relevant. After backtesting, forward test (paper trade) for at least two to four weeks using real-time data and actual execution before risking real capital.
Can I use the same strategy on multiple currency pairs?
Yes, but test it separately on each pair.
Different pairs have different volatility, liquidity, and correlation patterns. A strategy profitable on EUR/USD may fail on GBP/JPY. Test each pair independently to ensure the strategy works across your intended universe.
Next step
Developing a viable forex trading strategy requires clear definition, rigorous testing, and disciplined execution.
Start by selecting a strategy type aligned with your available time and risk tolerance. Use historical backtesting to validate the concept, then forward test on a demo account to ensure real-time execution matches expectations. Use step-by-step trading guides to implement your strategy on your chosen platform.
Remember: backtesting isn't prediction, forward testing isn't guarantee, and leverage isn't free. A strategy that worked yesterday may fail today as market conditions change. Begin small, track results carefully, and adjust only when supported by statistically meaningful data. Invest in a managed strategy if building and testing your own plan doesn't fit your schedule or skill set.
Risk Warning: CFD trading carries the high risk of losing money. Leverage products amplify both gains and losses. You may lose more than your initial investment. Never trade with capital you cannot afford to lose. Past performance is not indicative of future results. This article is educational information, not investment advice or a recommendation to trade.
TagsTrading Educationprop tradingprop firms