
Forex Technical Analysis: Charts, Structure, Signals, Limits
Published Updated
By NextTrade Editorial
Technical analysis is a method for understanding forex price movements by studying price action, chart patterns, and market structure. It assumes all available information is reflected in price and that identifiable trends and patterns can signal potential future direction. But it cannot predict prices with certainty. Most indicators lag actual price moves. Patterns fail regularly, and sudden fundamental events like economic data releases or central bank announcements can override technical signals entirely. This guide explains what technical analysis is, how traders use it, its practical constraints, and why no technical signal guarantees a profitable outcome.
Quick answer: what technical analysis can and cannot tell you
Technical analysis can help you identify trends, locate support and resistance levels, and recognize chart patterns that suggest potential price direction or reversal points. It organizes market observation into a structured framework and can reveal where other traders may be watching the same price levels.
It can't account for sudden news events or geopolitical shifts. It relies on lagging indicators that confirm past price movements rather than predicting future ones. False signals arrive regularly. And it's partly self-fulfilling: patterns gain power because traders act on them, not necessarily because they have inherent predictive power. Technical analysis is a tool for organizing observation, not a method that eliminates trading risk or guarantees profitable outcomes.
What the term means: core definitions in technical analysis
Technical analysis evaluates investments and identifies trading opportunities by analyzing statistical trends gathered from trading activity, such as price movement and volume. It differs from fundamental analysis, which examines economic data, interest rates, and macroeconomic events.
Price Action is the raw movement of a currency pair's price plotted over time. Technical analysts build all other observations from price action: the foundation layer of any chart.
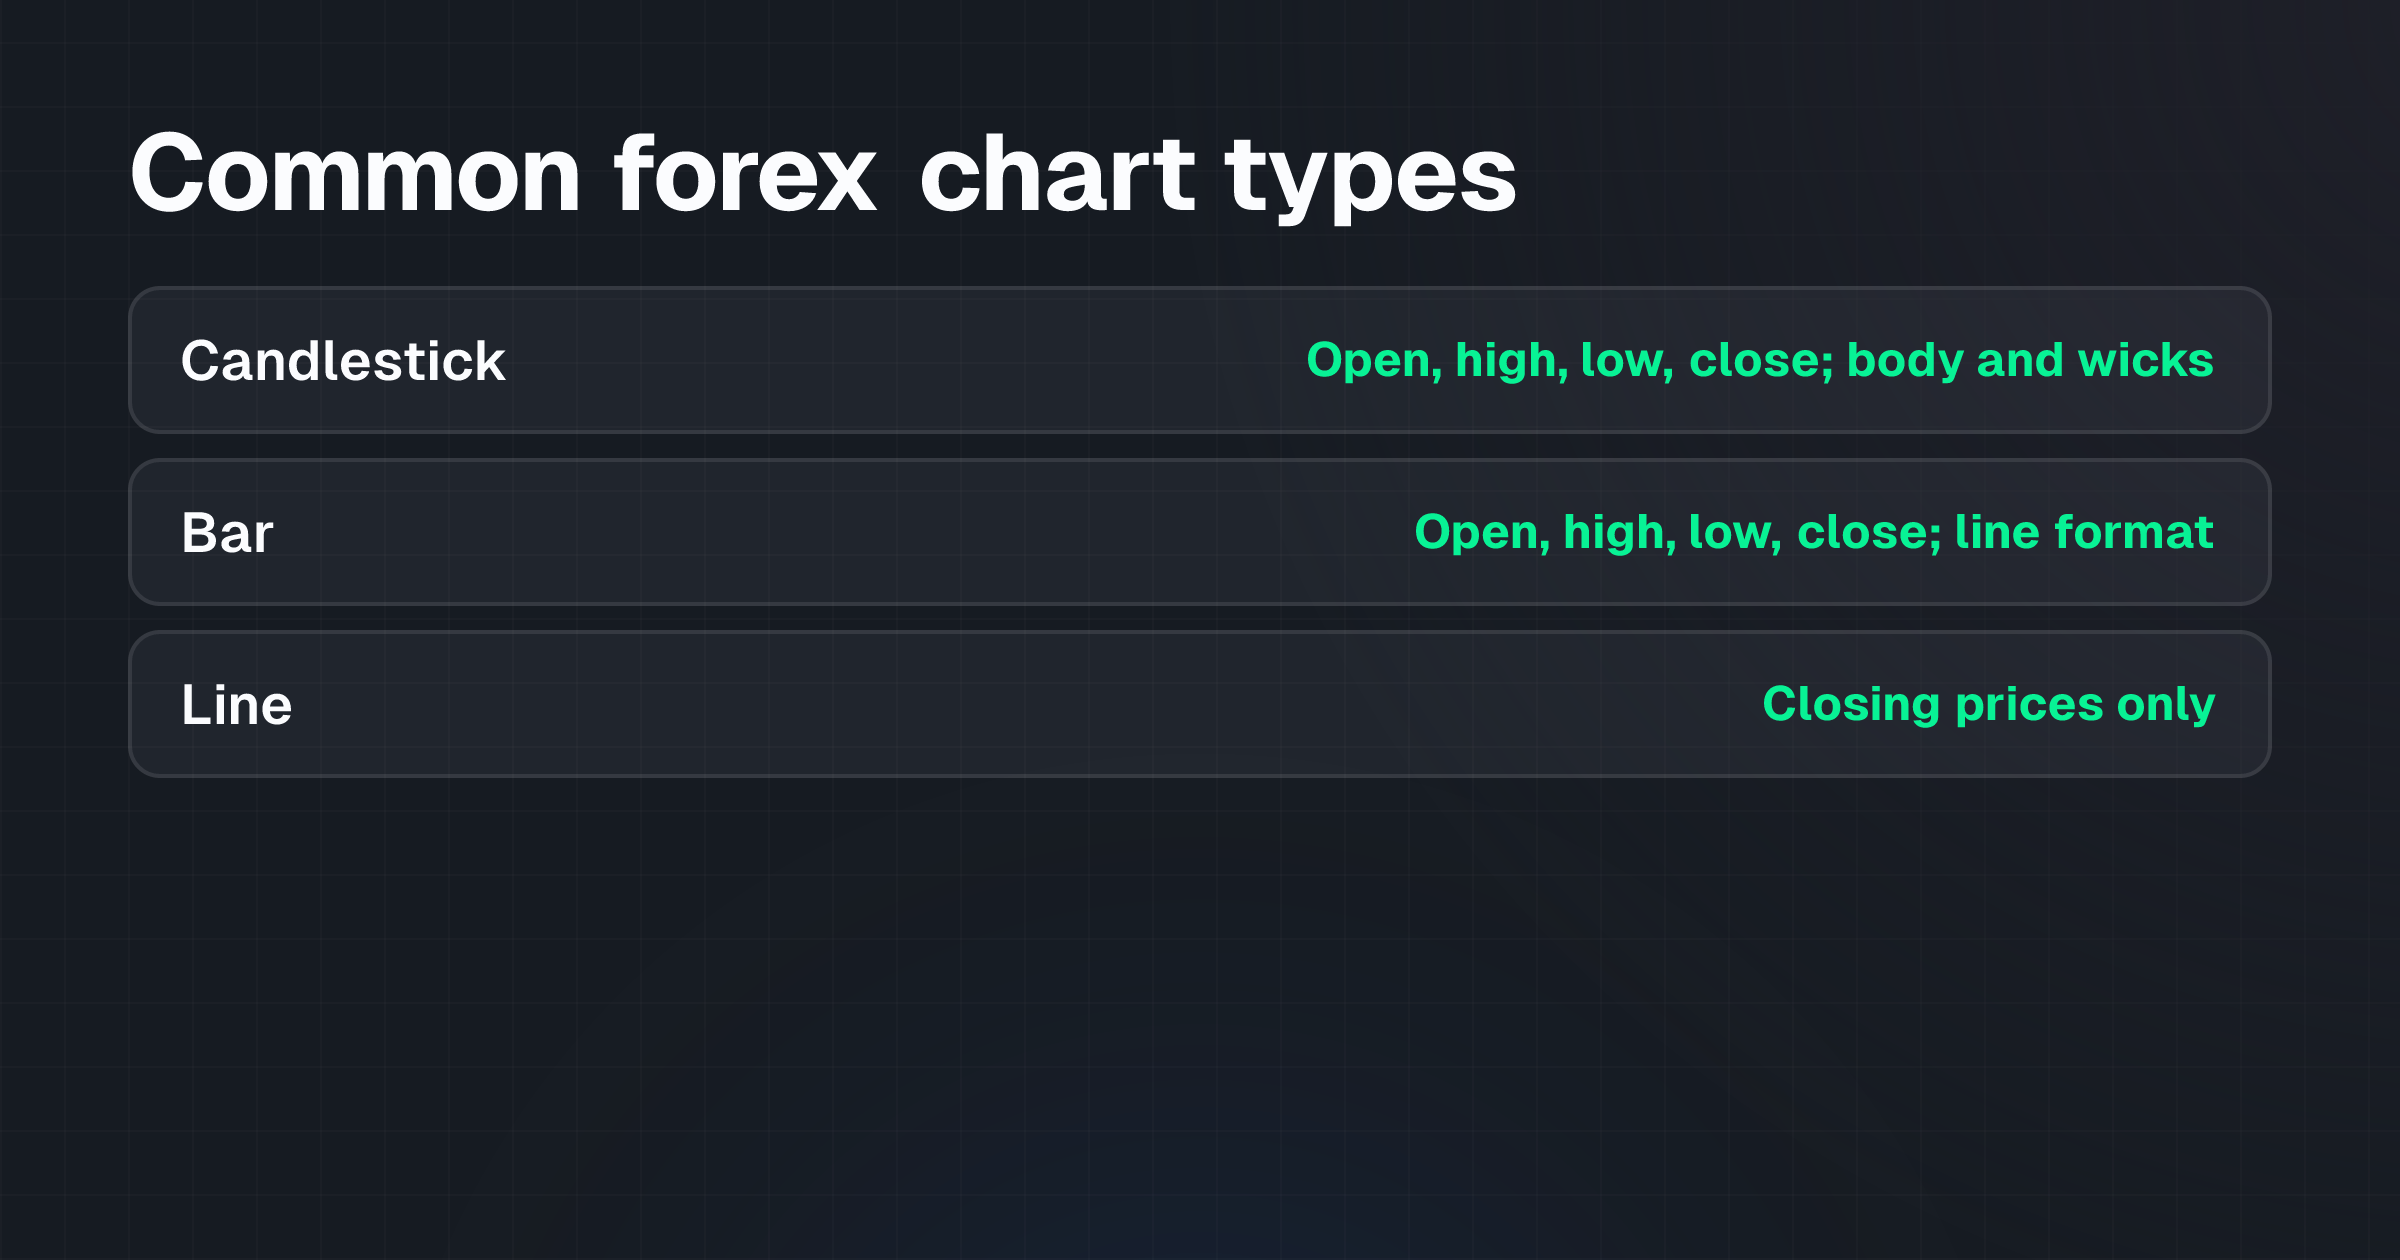
Charts are visual representations of price action. Three common types appear in forex analysis:
- Candlestick Charts display the open, high, low, and close price for a defined period. The solid body shows the open and close; the upper and lower wicks show the high and low. Widely used for identifying patterns and sentiment shifts.
- Bar Charts are similar to candlesticks, showing open, high, low, and close prices, typically using lines instead of solid bodies.
- Line Charts connect closing prices over time, offering a simpler view of trend direction without the detail of candlesticks or bars.
Market Structure describes recurring formations and levels within price action:
- Support and Resistance are price levels where historical buying (support) or selling (resistance) pressure has been strong enough to prevent price from moving further in one direction.
- Trend Lines are lines connecting significant highs or lows to visualize the direction and strength of a trend.
- Uptrend means a series of progressively higher price peaks followed by progressively higher troughs.
- Downtrend means a series of progressively lower price peaks followed by progressively lower troughs.
- Range or Consolidation describes periods where price moves sideways within defined support and resistance levels.
Technical Signals and Patterns are recognizable formations within charts:
- Chart Patterns (head and shoulders, triangles, double tops and bottoms) are geometric shapes formed by price action, often interpreted as continuation or reversal signals.
- Candlestick Patterns (doji, hammer, engulfing) are specific formations of one or more candlesticks that may signal shifts in trader sentiment.
- Indicators (moving averages, RSI, MACD) are mathematical calculations based on price and volume data, displayed as lines on or below the price chart. They're typically categorized as trend-following, momentum, volatility, or volume indicators.
Timeframes refer to the period represented by a single bar or candlestick. A 1-minute chart shows price movement over 1 minute per candle; a daily chart shows price movement over 1 day per candle. The significance of patterns can vary markedly across timeframes.
How it works: the technical analysis process
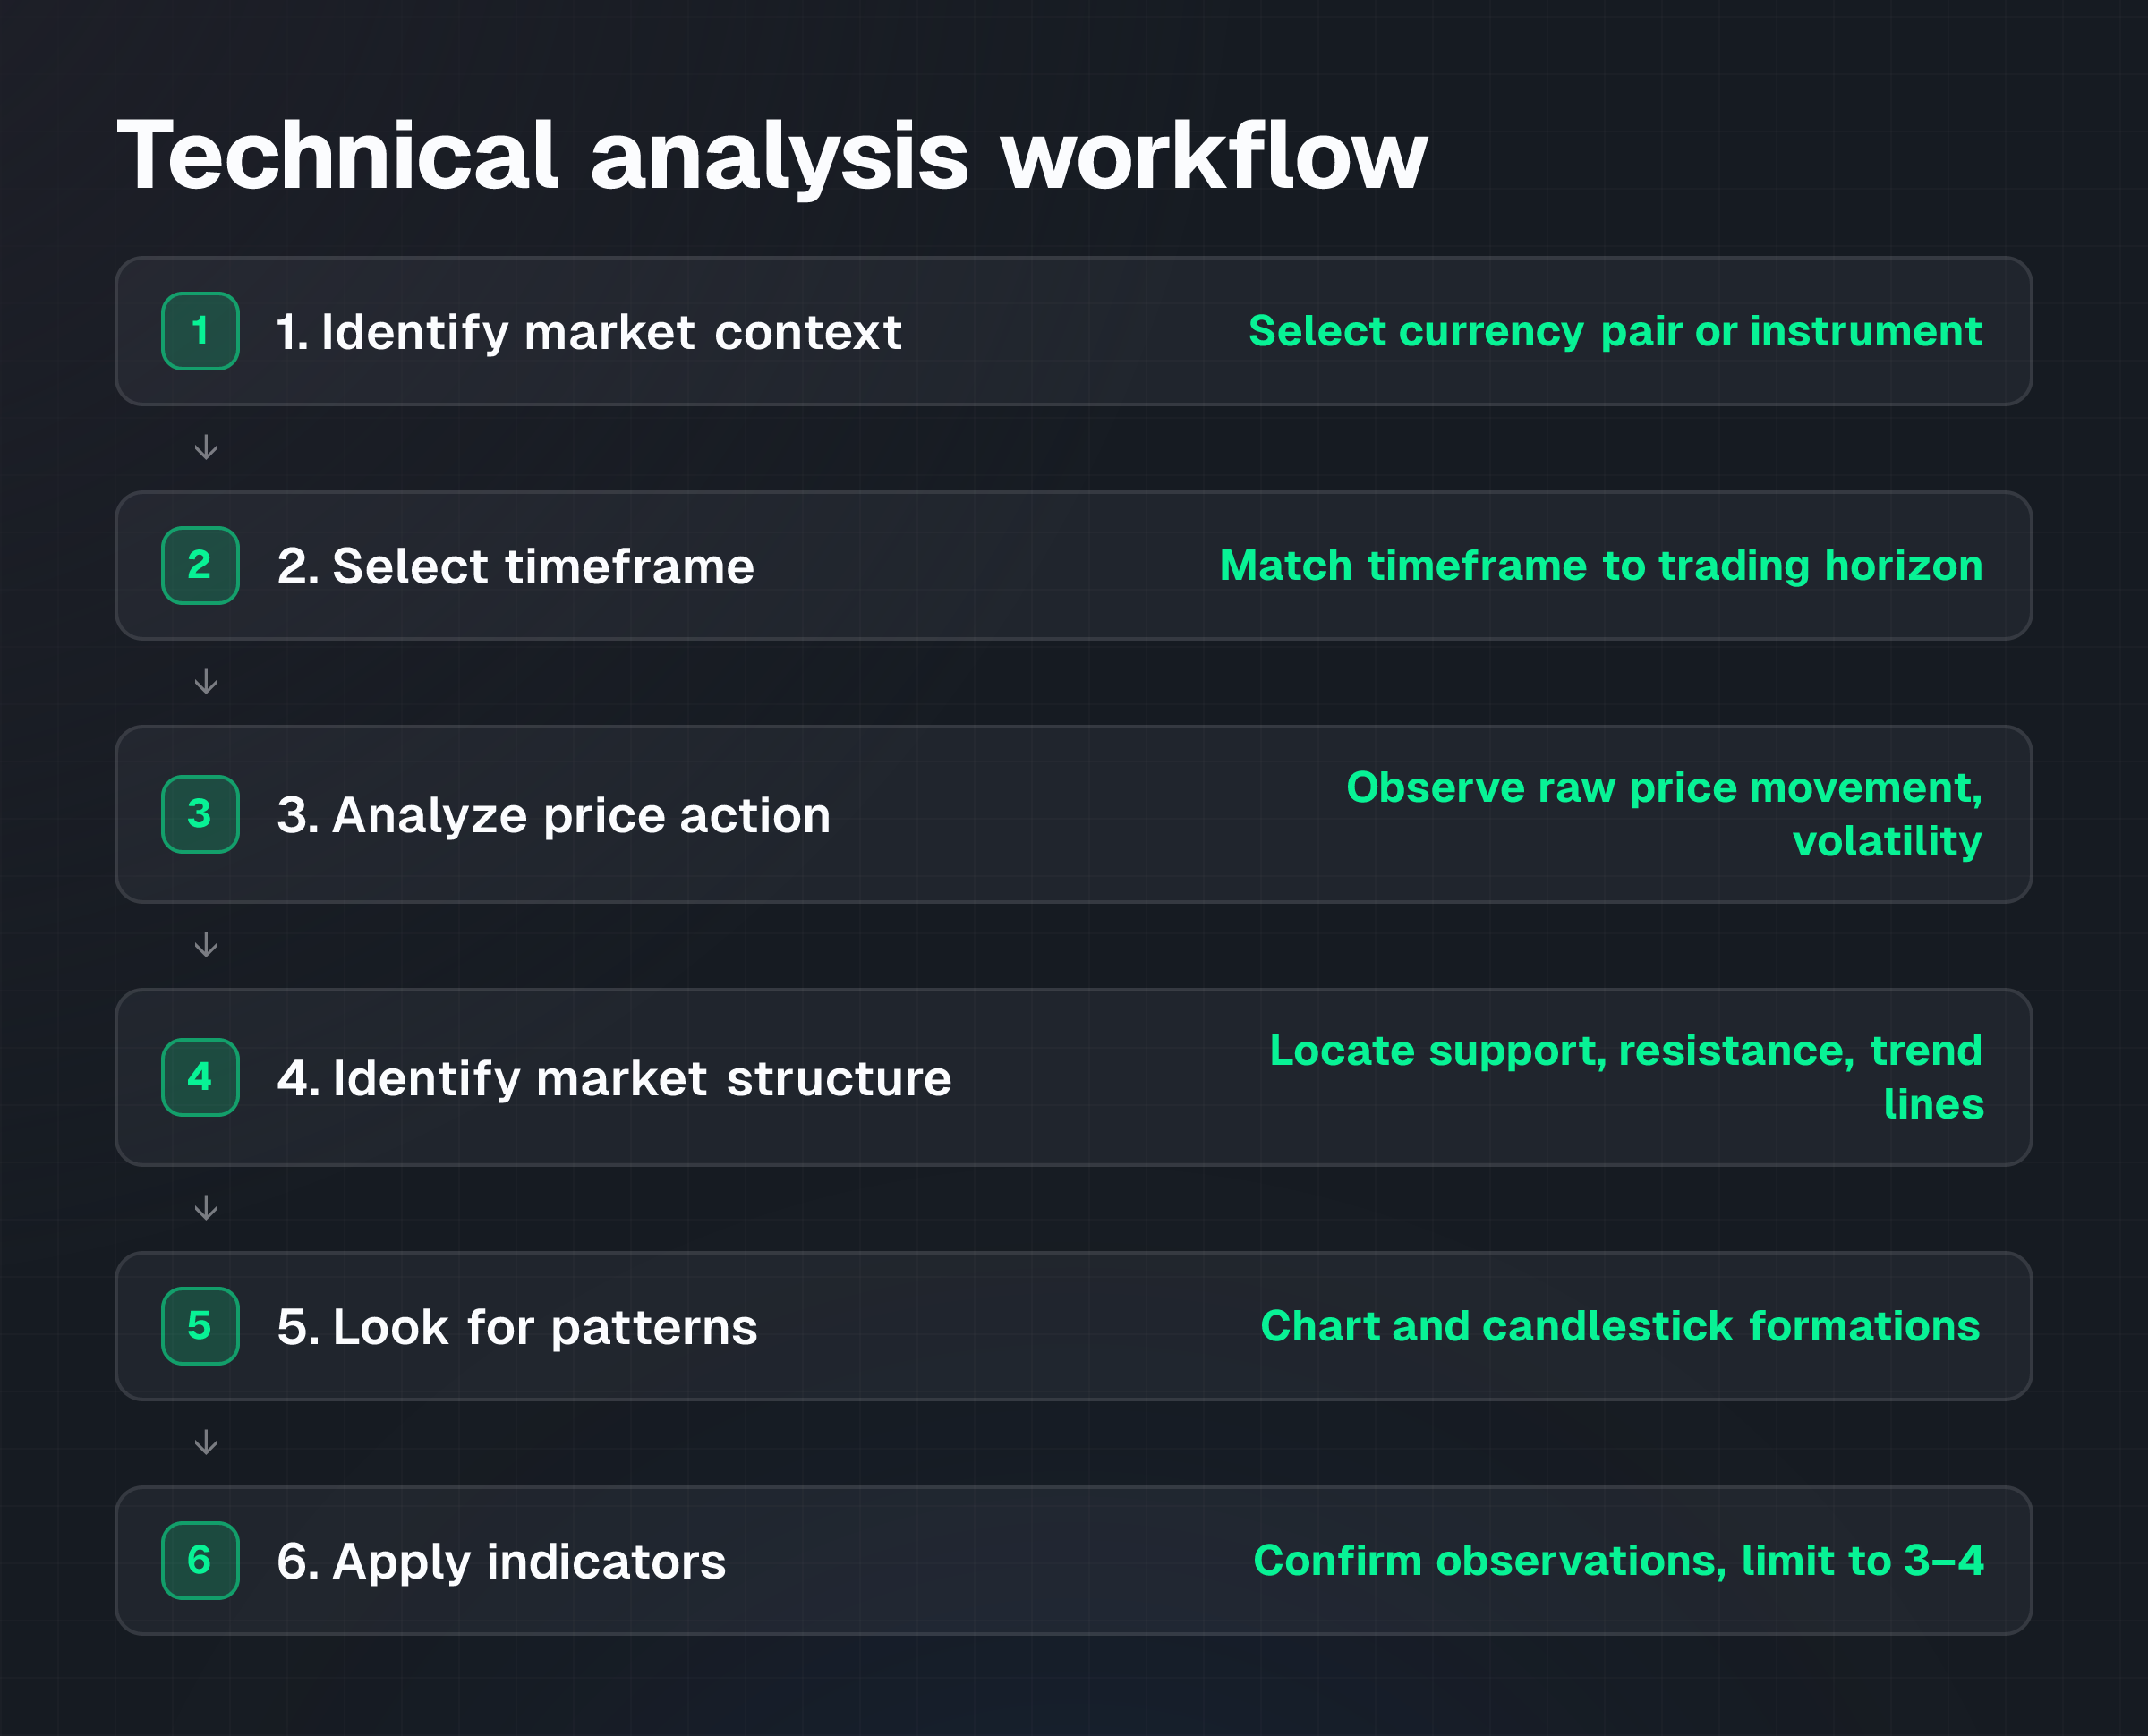
Technical analysis follows a structured sequence, starting with market context and ending with risk management decisions before any trade is placed.
-
Identify the market context. Select the specific currency pair or instrument you wish to analyze.
-
Select a timeframe. Choose a timeframe appropriate for your intended trading horizon: shorter timeframes for scalping, longer timeframes for swing trading or position trading.
-
Analyze price action. Observe the raw movement of price on the chart. Note whether price is rising, falling, or moving sideways. Identify areas where volatility increases or decreases.
-
Identify market structure. Locate key support and resistance levels where price has repeatedly reversed or paused. Draw trend lines if a clear uptrend or downtrend is visible. Determine whether the market is trending (up or down) or ranging sideways.
-
Look for chart and candlestick patterns. Identify recurring formations that traders commonly interpret as continuation or reversal signals.
-
Apply technical indicators. Use selected indicators to confirm observations from price action and market structure, or to generate additional signals. Avoid using too many indicators simultaneously, as conflicting signals may result.
-
Formulate a hypothesis. Based on combined technical observations, develop a potential scenario for where price might move next and under what conditions.
-
Consider risk management. Determine entry and exit points, including stop-loss and take-profit levels, before placing any trade. This is a critical step that many traders neglect. See Forex Risk Management: Position Sizing and Stop-Losses for detailed guidance.
-
Monitor and adjust. Continuously observe price action and be prepared to adjust your hypothesis or trade based on new information or changes in market structure.
Worked example: identifying a trend and support level
This example is hypothetical and educational. It illustrates how the process works in practice and does not constitute a recommendation to place a trade.
Suppose you're analyzing the EUR/USD pair on a daily timeframe. Over the past 40 days, you observe that price has formed a series of higher lows: 1.0850, 1.0920, 1.0980. The corresponding peaks are also progressively higher: 1.1050, 1.1120. This pattern indicates an uptrend.
You then draw a trend line connecting the three higher lows (1.0850 → 1.0920 → 1.0980). This line represents potential support: a level where buying interest has historically emerged.
You apply a 50-period moving average to the chart. The current price is 1.1050, and the moving average is at 1.0950, confirming that price is trading above its medium-term average, another sign of an uptrend.
You note that price has touched the 1.1000 level multiple times without breaking through. This level acts as resistance: a point where selling pressure has repeatedly emerged.
Based on this analysis, your hypothesis is: "The uptrend is likely to continue as long as price remains above the trend line at approximately 1.0980." You would set a stop-loss below that level (for instance, at 1.0950) to define your maximum acceptable loss if the trend reverses.
This structured observation provides a framework for decision-making. But it doesn't guarantee that price will move as expected. The trend could reverse without warning, and a sudden news event could override all technical signals.
Costs and practical constraints: what to consider before analyzing charts
Technical analysis itself has no direct cost, but applying it involves trade execution costs and platform constraints.
Platform requirements. Conducting technical analysis requires access to a charting platform with drawing tools, indicators, and multiple timeframe views. NextTrade offers MetaTrader 5 and TradeLocker, both of which provide the necessary charting functionality, including candlestick and line charts, trend line tools, and a range of technical indicators.
Data quality and feed latency. The accuracy of technical analysis depends on the quality and timeliness of price data. Delayed or inaccurate price feeds can lead to false signals or missed levels.
Timeframe selection trade-offs. Shorter timeframes (1-minute, 5-minute) reveal more price detail but generate more false signals and require constant monitoring. Longer timeframes (daily, weekly) reduce noise but may miss shorter-term opportunities and require patience.
Subjectivity. Interpreting charts involves judgment. Two traders may draw trend lines or identify support levels differently on the same chart, leading to different conclusions. This subjectivity is a practical constraint that can't be eliminated.
Tool overload. Modern charting platforms offer dozens of indicators. Using too many simultaneously can produce conflicting signals and analysis paralysis rather than clarity. Most professional traders limit themselves to three or four key indicators.
Execution costs matter for active traders. If your technical analysis leads to frequent trades, spreads, commissions, and overnight financing charges accumulate. NextTrade offers different fee structures suited to various trading frequencies. Active traders may benefit from accounts with tighter spreads and lower commissions, though these typically require larger minimum deposits.
Risks and limitations: why technical analysis fails
Technical analysis is not a reliable predictor of future price movement. Understanding its key limitations is essential before relying on it for trading decisions.
Lagging indicators. Most technical indicators are derived from historical price data. A moving average of the past 50 days, for example, reflects what has already happened, not what will happen next. By the time an indicator generates a signal, price may have already moved significantly in the opposite direction.
False signals. Technical patterns and indicator signals regularly fail to materialize as expected. A breakout above resistance may reverse within hours. A reversal pattern may signal a move that never occurs. False signals are a routine feature of technical analysis, not an anomaly.
Fundamental events override patterns. Technical analysis ignores macroeconomic data, central bank policy, geopolitical crises, and earnings announcements. A technical pattern suggesting further downside can be erased in seconds by a surprise interest rate cut or a positive economic report. When fundamental news is significant, technical signals often fail.
Subjective interpretation. Support and resistance levels, trend line placement, and pattern identification depend on trader judgment. What one analyst reads as a strong resistance level, another may dismiss as minor noise. This subjectivity introduces variability and reduces the reliability of technical signals across different analysts.
Self-fulfilling prophecy. Technical patterns gain power because many traders watch and act on them simultaneously. When enough traders see support at a particular level and place buy orders, price tends to bounce, not because the level has inherent value, but because traders have collectively decided to treat it that way. This self-fulfilling aspect can break down suddenly if market conditions change or if traders' collective attention shifts.
Lack of guaranteed profitability. Technical analysis does not and cannot guarantee profitable outcomes. Trading always carries risk of loss. CFDs are complex instruments and carry a high risk of losing money. No pattern, indicator, or chart formation can eliminate this risk.
Overreliance leads to over-trading. Traders who rely heavily on technical analysis may enter more trades than are warranted, increasing exposure to transaction costs and slippage. Over-analysis and over-trading are common pitfalls.
Common misunderstandings: what technical analysis is not
It is not prediction. Technical analysis doesn't predict future price movement. It identifies areas where price has historically reacted and patterns that traders commonly observe. Identifying a pattern is not the same as forecasting where price will move.
It is not a substitute for risk management. Many traders hope that perfect technical analysis will eliminate the need for stop-losses or position sizing. This is incorrect. Even the strongest technical signal can fail, and risk management is essential regardless of technical observations.
It is not guaranteed to work on all instruments or timeframes. A pattern that works reliably on the daily EUR/USD chart may produce far more false signals on a 1-minute chart or on a less liquid commodity pair. Pattern effectiveness varies across instruments and timeframes.
It is not a reason to ignore fundamental analysis. Technical analysis and fundamental analysis serve different purposes. Ignoring major economic events or central bank announcements in favor of pure technical signals is a recipe for substantial losses, especially around scheduled news releases.
It is not the only tool available. Forex Trading Strategies: Types, Examples and Risks details multiple approaches to market analysis and strategy. Technical analysis is one tool, useful in some contexts and less useful in others.
It does not work equally well in all market conditions. Technical patterns tend to work better during trending markets and may fail frequently in choppy, sideways, or highly volatile conditions. Range-bound trading strategies may work well; trending strategies may not, and vice versa.
Practical checklist: steps to apply technical analysis safely
Before you use technical analysis to guide any trading decision, work through this checklist:
- Have you selected a specific currency pair and timeframe appropriate for your strategy?
- Have you identified the current trend or range using price action and trend lines?
- Have you located key support and resistance levels with multiple touches or reversals in the past?
- Have you identified a specific chart or candlestick pattern?
- Have you applied one or two key indicators to confirm your observation, not to contradict it?
- Does your technical hypothesis align with the broader market structure and timeframe above your chosen timeframe?
- Have you determined a specific stop-loss level below (for long trades) or above (for short trades) your intended entry, based on risk management principles?
- Have you calculated your position size so that a move to your stop-loss level represents a loss you can accept?
- Have you identified what price action or fundamental event would invalidate your hypothesis?
- Have you considered how a surprise news event might override your technical signals?
- Are you prepared to exit the trade if price breaks your stop-loss, regardless of what technical analysis suggests?
- Have you reviewed the trading costs (spreads, commission, overnight financing) that apply to your intended trade?
Frequently asked questions
What is the difference between technical and fundamental analysis?
Technical analysis studies price action, patterns, and indicators to infer trader sentiment and potential future price moves. Fundamental analysis examines economic data, interest rates, inflation, and geopolitical events to determine fair value. Technical analysis assumes all information is reflected in price; fundamental analysis tries to identify when price has diverged from fair value due to sentiment or temporary imbalance.
Can I use technical analysis alone to trade forex profitably?
Technical analysis can be a useful tool for identifying potential entry and exit points, but it can't guarantee profitable outcomes. Many successful traders combine technical analysis with fundamental analysis, risk management, and emotional discipline. Trading involves risk of loss regardless of which analytical approach you use.
Why do technical indicators sometimes give conflicting signals?
Technical indicators are mathematical transformations of price and volume data. Different indicators measure different aspects of market behavior: momentum, trend, volatility, or volume. Two indicators may point in opposite directions because they're designed to answer different questions. Using too many indicators simultaneously often produces confusion rather than clarity.
How do I know if a support or resistance level is significant?
Support and resistance levels tend to be significant if price has touched or bounced from them multiple times in the past, or if they coincide with round numbers (e.g., 1.1000) or previous highs and lows. Levels with only one or two touches in the past are less reliable. Drawing trend lines through multiple reversals also increases confidence.
What timeframe should I use for technical analysis?
The appropriate timeframe depends on your trading horizon and strategy. Scalpers typically use 1-minute to 15-minute charts; day traders use hourly or 4-hour charts; swing traders use daily or weekly charts. Shorter timeframes generate more trading signals but also more false signals. Longer timeframes are less noisy but require more patience and may miss short-term opportunities.
Does technical analysis work better on some currency pairs than others?
Technical analysis tends to work more reliably on major, highly liquid pairs (such as EUR/USD, GBP/USD, USD/JPY) where large volumes of traders are actively trading. Less liquid pairs or exotic currency crosses may generate more false signals and less reliable support and resistance levels.
Next step
If you're new to technical analysis, start by learning to read candlestick charts and identify basic support and resistance levels on a daily timeframe. Paper trade (use a demo account without real money) to practice identifying trends and patterns before risking real capital. As you build experience, NextTrade's onboarding guides provide practical steps for opening an account and familiarizing yourself with a trading platform.
To explore the platforms available for conducting technical analysis, review MetaTrader 5 vs TradeLocker: Which Platform Should You Use? to compare charting tools and indicator libraries. How to Choose Forex Pairs for Your Trading Strategy provides guidance on selecting instruments suited to technical analysis and your risk tolerance.
Remember that technical analysis is one tool among many. Successful trading requires solid risk management, clear trading rules, and emotional discipline. No technical signal can guarantee a profitable outcome, and losses are possible even when your analysis appears sound.
Important disclosure
CFDs are complex instruments and carry a high risk of losing money rapidly due to leverage. Retail client accounts with this broker lose money when trading CFDs. You should consider whether you understand how CFDs work and whether you can afford to take the high risk of losing your money. Past performance does not indicate future results. This article is educational material only and does not constitute investment advice or a recommendation to buy, sell, or hold any position.
TagsTrading Educationforex technical analysistechnical analysis forexchart patternssupport and resistance