

Support and resistance zones are price areas where forex markets have historically reversed or paused. Support acts as a floor where buying interest tends to halt downward movement; resistance acts as a ceiling where selling pressure stops upward movement. These zones help traders plan entries, exits and stop-loss placement with greater precision. This article explains how to mark meaningful zones, set their boundaries, distinguish bounces from failed breakouts, and define when a zone is invalidated.
Quick answer: How to identify support and resistance
Look for significant peaks and troughs where price clearly reversed direction.
Draw horizontal lines or zones through those turning points. The more times price has touched or bounced from a zone without breaking through, the stronger it's considered, but strength doesn't guarantee the zone will hold on the next test.
Support and resistance can also be dynamic, represented by trendlines or moving averages that adjust as price moves. Round numbers like 1.1000 on EUR/USD often act as psychological zones due to collective trader behaviour. A level strong on a daily chart may differ from one on an hourly chart, so check multiple timeframes before making a trading decision.
What the term means
Support and resistance are foundational concepts in technical analysis that describe where price tends to pause or reverse direction.
Support is a price zone where downward price movement typically slows or stops. When price falls toward support, buying pressure tends to increase, either halting the decline or pushing price back upward. Traders watch for buying interest to emerge at or near these levels.
Resistance is a price zone where upward price movement typically slows or stops. When price rises toward resistance, selling pressure tends to increase, either halting the advance or pushing price back downward.
Static versus dynamic support and resistance
These zones can be static or dynamic. Static levels are fixed price points derived from previous highs and lows on the chart. If EUR/USD peaked at 1.0950 three times over the past month, that level becomes resistance. Dynamic levels change over time and are typically represented by trendlines or moving averages that adjust as price moves. A moving average acts as dynamic support or resistance because it shifts with each new candle.
Market structure and zone strength
Market structure describes how price interacts with these zones, forming patterns like higher highs and higher lows in an uptrend, or lower highs and lower lows in a downtrend.
When price repeatedly touches a zone without breaking through, that zone gains strength. A zone tested five times without violation is generally considered stronger than one tested once. Strength is not a guarantee. Market conditions change.
Bounces, breakouts and failed breakouts
A bounce occurs when price approaches a support or resistance zone, shows rejection through candlestick patterns, and reverses without closing significantly beyond the zone.
A breakout occurs when price moves decisively through a zone, often with strong momentum. A failed breakout (or false breakout) is when price briefly moves beyond a zone but quickly reverses back within it, trapping traders who entered on the breakout signal.
How it works
Identifying and using support and resistance involves four core steps: selecting meaningful zones, setting their boundaries, distinguishing bounces from failed breakouts, and defining invalidation.
Step 1: Select meaningful zones
Start by identifying the most obvious turning points on the chart where price clearly reversed. Avoid marking every minor bounce; focus on significant peaks and troughs that stand out visually.
Prioritise higher timeframes. A level strong on a daily chart generally holds more weight than one on an hourly chart. Check multiple timeframes before committing to a trading decision.
Look for multiple touches. The more times price has approached and reacted to a specific area without breaking through, the stronger the zone. Treat touch counts as a conditional clue rather than a rule; a zone might break on the first retest if underlying market conditions have changed.
Consider volume as a conditional clue. In forex, where volume data is often inferred from tick data rather than directly visible, higher trading activity around a potential support or resistance zone can lend it more credence. Volume should not be used in isolation.
Step 2: Set zone boundaries
Rather than marking a single price line, define a narrow price range for the zone, acknowledging that price rarely reverses at an exact point.
Draw horizontal lines through the wicks and body closes of significant turning points. Establish a range that encompasses previous reactions, typically 10 to 20 pips wide depending on the pair and timeframe. Use charting tools like rectangles to visually define these zones and make them easier to spot on live charts.
Step 3: Distinguish bounces from failed breakouts
A bounce shows price rejection at or near a zone and reverses without closing significantly beyond it. Look for candlestick patterns like pin bars (not inverted hammers, which form in different contexts) or bullish engulfing patterns that signal rejection.
A failed breakout shows price moving beyond the zone, often with strong momentum initially, but then quickly reverting back within the original zone. Failed breakouts can trap traders who entered expecting a continuation.
Step 4: Define invalidation
A support or resistance zone is considered invalidated (broken) when price makes a decisive close beyond it, especially on a higher timeframe or through multiple closes.
After a breakout, if price retests the old zone and fails to break back through it, the invalidation is confirmed. Invalidation often coincides with a change in market structure, such as a higher low failing to form during an uptrend.
Moving averages as dynamic support and resistance
Moving averages can offer dynamic support and resistance, but their effectiveness varies based on market conditions and the periods chosen. Do not rely on them in isolation.
A 50-period or 200-period moving average is commonly watched, but no single period works in all market conditions. Use moving averages as one clue among several, not as a standalone signal.
Worked example: EUR/USD with successful bounce and failed breakout
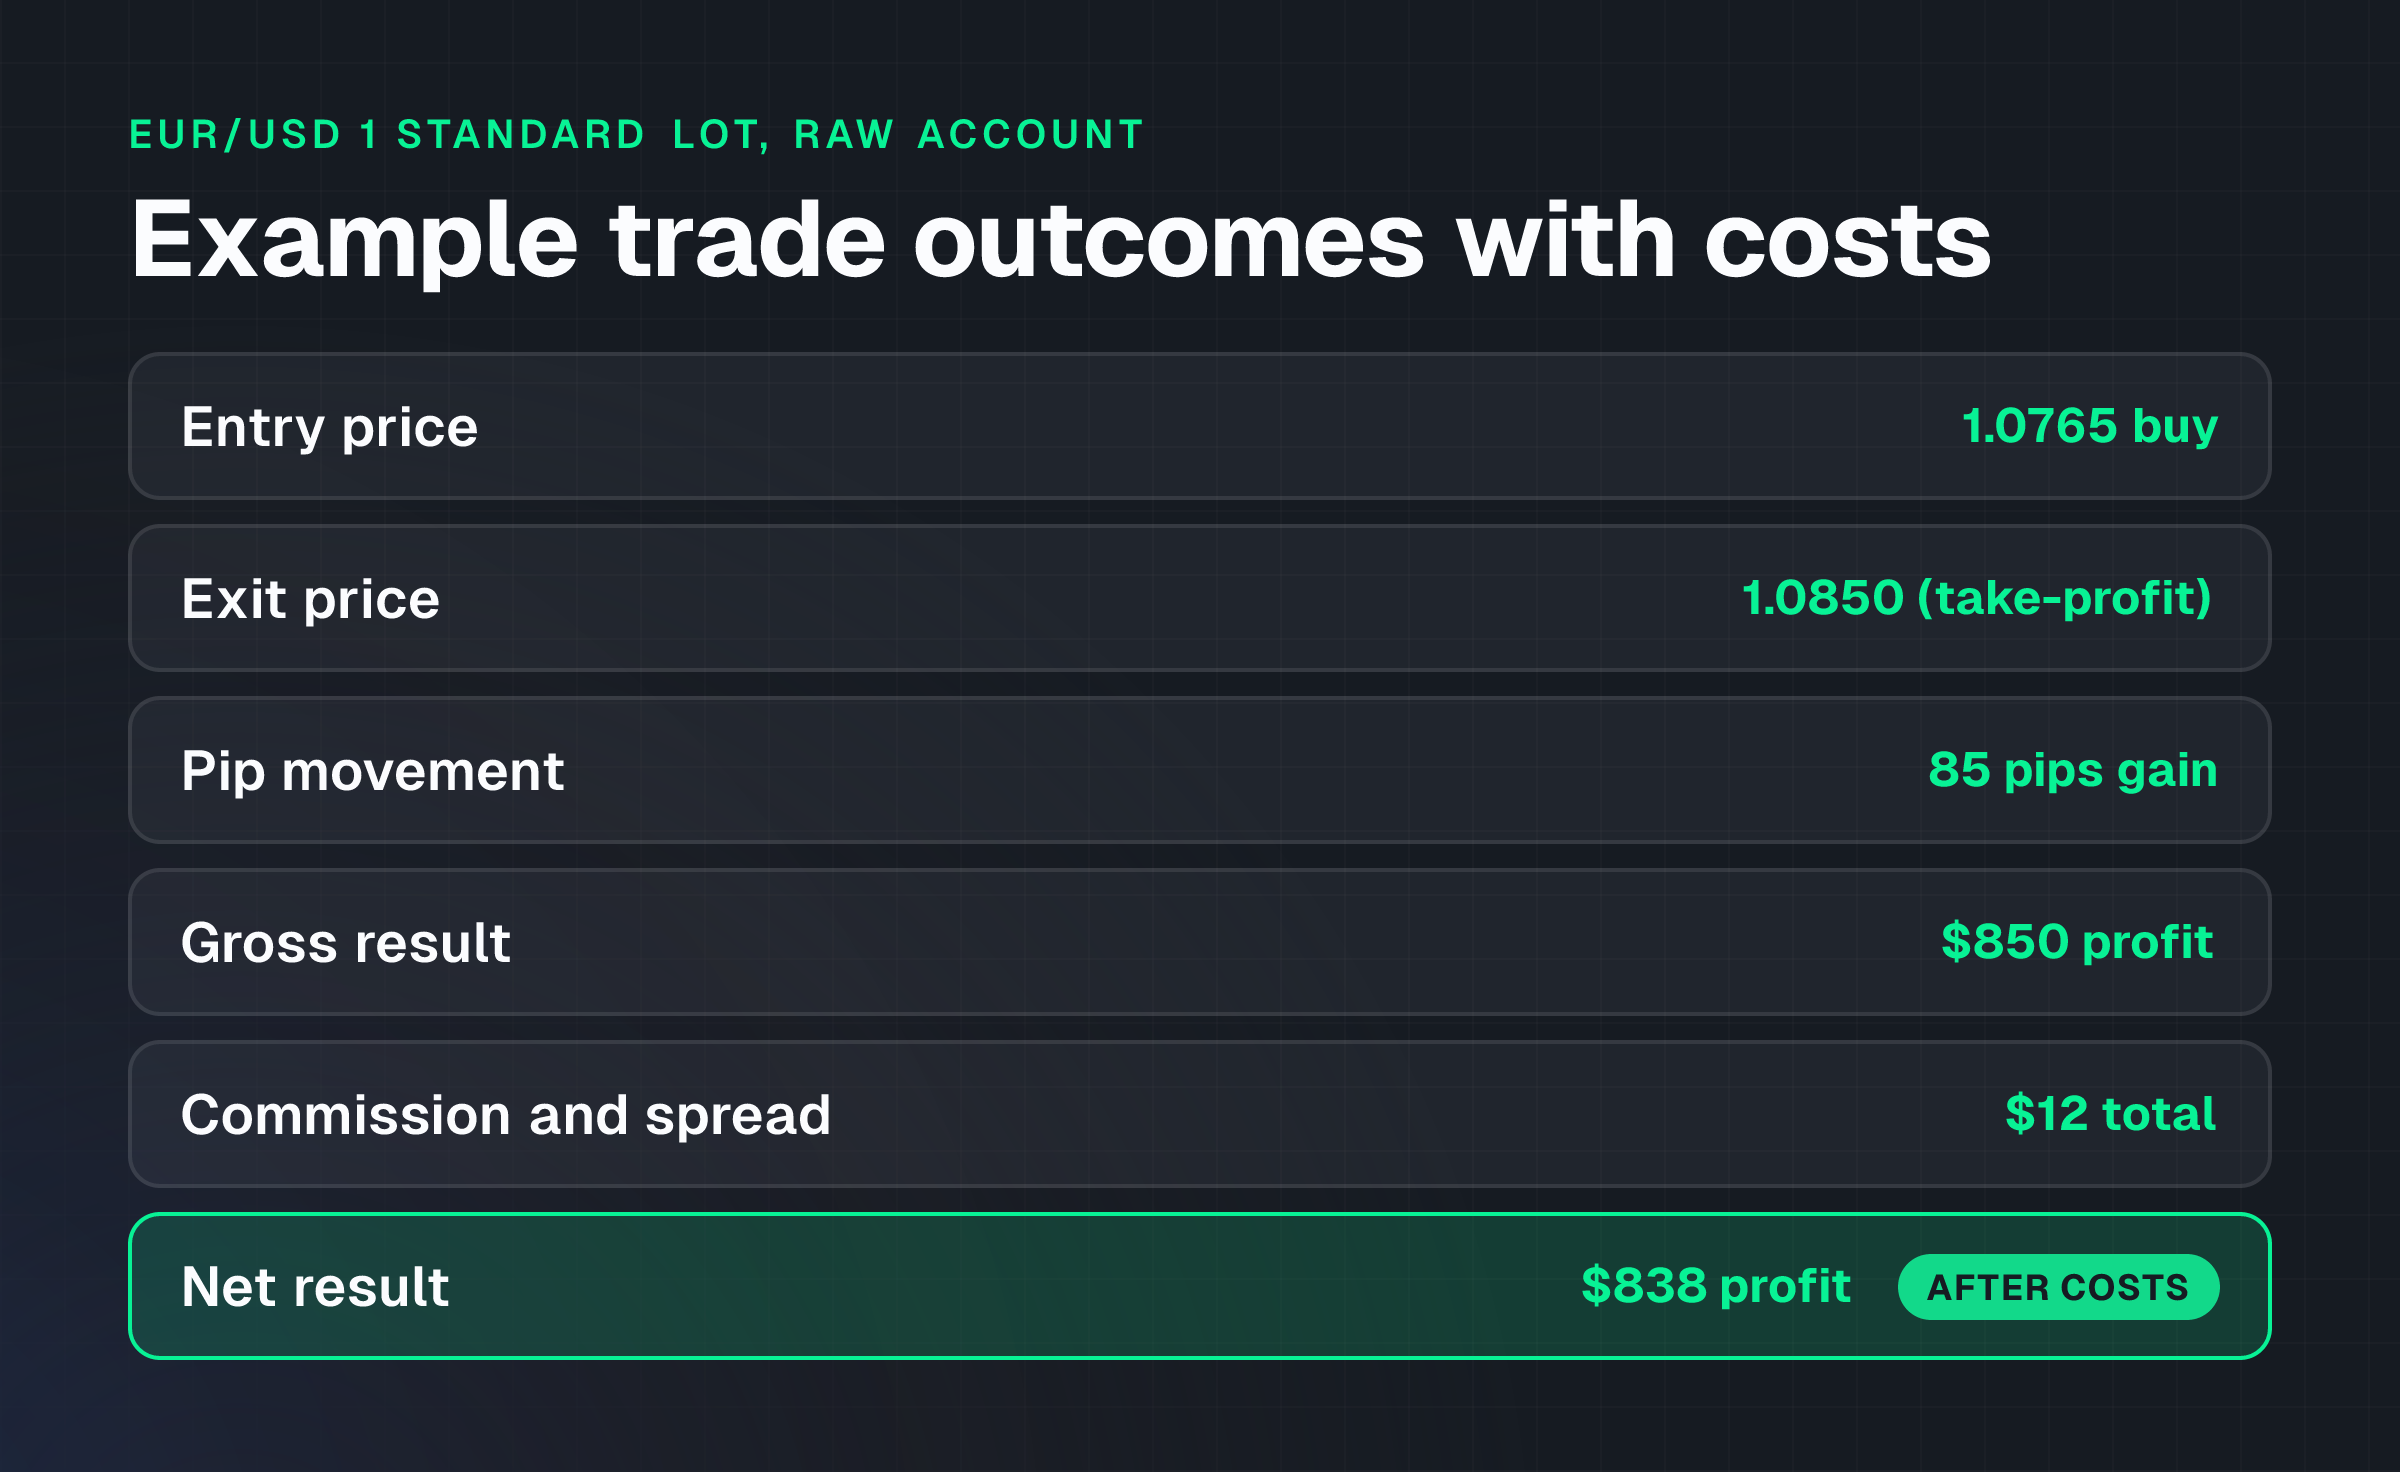
This example uses hypothetical EUR/USD trades to illustrate how support and resistance work in practice. These are educational illustrations and not recommendations to place trades.
Example 1: Successful bounce from support
Context: EUR/USD has been trending downward but shows signs of slowing. Price approaches a well-established support zone around 1.0750-1.0760 on the 4-hour chart, where it has bounced three times in the past month.
Entry: Price enters the 1.0750-1.0760 zone and a strong bullish candlestick pattern (such as a bullish pin bar or engulfing pattern) forms, signalling rejection. The trader decides to buy 1 standard lot (100,000 units) of EUR/USD at 1.0765.
Stop-loss: Placed below the support zone at 1.0730.
Take-profit: Targeting the next resistance zone around 1.0850.
Outcome: Price bounces from support, moves upward, and hits the take-profit target.
Calculation (Raw Account with $100 minimum deposit):
- Entry: Buy 1 standard lot at 1.0765
- Exit: Sell 1 standard lot at 1.0850
- Pip gain: (1.0850 − 1.0765) × 10,000 pips = 85 pips
- Gross profit: 85 pips × $10/pip (standard lot EUR/USD) = $850
- Commission: $7 round-trip (Raw Account on NextTrade)
- Spread cost: Raw Account spreads start from 0.0 pips; assume 0.5 pips = approximately $5
- Net profit: $850 − $7 − $5 = $838
Execution assumptions: Market order filled at specified prices; no slippage; no overnight financing charges.
Example 2: Failed breakout of resistance
Context: EUR/USD has been pushing higher but struggles at a resistance zone around 1.0890-1.0900 on the 4-hour chart. The trader sees price attempting to break above it.
Entry: Price appears to break above the 1.0890-1.0900 resistance zone with a strong bullish candle closing just above it. The trader decides to buy 1 standard lot at 1.0905, anticipating further upside.
Stop-loss: Placed just below the broken resistance (now expected to act as support) at 1.0880.
Take-profit: Targeting a higher resistance level around 1.0980.
Outcome: Price quickly reverses after breaking out, falling back below 1.0890 and hitting the stop-loss. This is a failed breakout or false breakout.
Calculation (Raw Account):
- Entry: Buy 1 standard lot at 1.0905
- Exit: Sell 1 standard lot at 1.0880 (stop-loss triggered)
- Pip loss: (1.0905 − 1.0880) × 10,000 pips = 25 pips
- Gross loss: 25 pips × $10/pip = $250
- Commission: $7 round-trip (Raw Account on NextTrade)
- Spread cost: Approximately $5
- Net loss: $250 + $7 + $5 = $262
Execution assumptions: Market order filled at specified prices; stop-loss executed without slippage.
Both examples show how support and resistance zones guide entry and exit decisions, and why the costs of spreads and commission must be factored into profitability calculations.
Spreads from 0.0 pips across 130+ instruments. Open Account
Costs and practical constraints
Using support and resistance requires understanding the real costs and constraints that affect profitability.
Trading costs
On NextTrade's Raw Account, which starts at a $100 minimum deposit, spreads start from 0.0 pips with a $7 commission per standard lot round-trip. On a Standard Account ($25 minimum deposit), spreads on EUR/USD start from 1.3 pips with no commission. These costs apply to every trade, reducing net profit on winning trades and adding to losses on losing trades.
In the successful bounce example above, the $7 commission and approximate $5 in spread costs reduced the gross profit of $850 to a net of $838. In the failed breakout example, the same $12 in costs added to the loss, bringing it from $250 to $262.
Over many trades, these costs accumulate significantly.
Subjectivity in zone marking
Marking support and resistance zones is partly objective (price did reverse there) but partly subjective (where exactly do you draw the boundary, and how wide should the zone be). Two traders looking at the same chart may draw zones in slightly different places. This means the same price action can trigger different entry and exit signals depending on how zones are marked.
Timeframe mismatch
A level strong on a daily chart may differ from one on an hourly chart.
A trader watching only the hourly chart might enter a trade at a "support level" that is actually in the middle of a breakdown on the daily timeframe. Always check multiple timeframes before making a trading decision.
News and volatility
Support and resistance zones are tools for normal market conditions. During high-impact news releases or periods of extreme volatility, price can gap through zones without warning or hesitation. A zone that held for weeks can fail instantly when major economic data is released.
Risks and limitations
Support and resistance are useful concepts, but they are not reliable price-reversal guarantees and carry significant limitations.
Not a price-reversal guarantee
Price can break through support or resistance at any time.
Markets are driven by the collective decisions of millions of traders responding to news, economic data, central bank decisions and shifting sentiment. A zone that held for three months can fail without warning. No technical analysis tool, including support and resistance, guarantees profitability or predicts future price movement.
Over-reliance creates tunnel vision
Focusing exclusively on support and resistance zones can lead traders to ignore broader market context. If a central bank signals an interest-rate increase, or if a currency is being sold across the board due to geopolitical risk, support levels that normally hold may break decisively.
Support and resistance should be used in conjunction with other analysis tools, including momentum indicators, trend analysis and fundamental factors.
Failed breakouts trap traders
When price briefly breaks through a zone and then quickly reverses, traders who entered on the breakout signal are trapped in losing positions. Failed breakouts are common and costly.
Waiting for confirmation, such as a retest of the zone that holds, or a second close beyond the zone, can reduce false-signal entries, but no confirmation method eliminates the risk entirely.
Leverage magnifies losses
Leverage increases market exposure, but it also increases the speed and scale of potential losses. A trader using 1:100 leverage to trade support and resistance zones can lose the entire account balance on a few failed breakouts.
Leverage does not change the accuracy of support and resistance zones; it only changes the size of the loss when zones fail.
Self-fulfilling prophecy, not fundamental truth
Support and resistance zones work partly because many traders watch the same zones and make the same trading decisions. This creates a self-fulfilling prophecy: price reverses at these zones because traders expect it to, not because of any fundamental market force.
When enough traders stop watching a particular zone, or when fundamental factors overwhelm technical expectations, the zone loses its power.
Common misunderstandings
Several common misconceptions about support and resistance can lead traders astray.
Misunderstanding 1: Zones are single price points
Support and resistance are not single, exact price levels. They are zones or areas where price tends to react.
A trader who places a stop-loss exactly at a support level (e.g., 1.0750 precisely) may be stopped out by a brief wick that touches just below 1.0750 before bouncing back up. Defining zones as ranges (1.0745-1.0755) accounts for the fact that price action is messy and rarely reverses at an exact point.
Misunderstanding 2: Multiple touches guarantee future support
While multiple touches do suggest a zone is meaningful, they do not guarantee that the zone will hold on the next test. Market conditions change.
A zone touched five times when sentiment is bullish may break decisively when sentiment shifts to bearish. Treat multiple touches as a conditional clue that increases the zone's credibility, but not as a law of price.
Misunderstanding 3: Support and resistance are interchangeable with momentum indicators
Support and resistance mark price areas; momentum indicators measure the strength and direction of price movement. They serve different purposes.
A zone can be strong (many touches) but momentum into that zone can be weak (small candles, low volume), suggesting a weak reversal. Using both together provides more complete information than either alone.
Misunderstanding 4: All round numbers are resistance
Round numbers like 1.1000 or 1.2000 often act as psychological resistance or support because traders round them mentally and place orders near them. However, not every round number is significant.
A round number in the middle of a smooth trend may offer no resistance at all. Focus on round numbers that coincide with previous price reversals or that lie at obvious chart turning points.
Misunderstanding 5: "Holy Grail" trading
No single technical analysis tool guarantees profitability. Support and resistance are useful for planning trades, but they are one tool among many.
Traders who rely entirely on support and resistance zones, ignoring broader market context, news and fundamental analysis, will face consistent losses when zones fail. Profitable trading requires a combination of tools, risk management and disciplined execution.
Practical checklist
Use this checklist before marking support and resistance zones on the chart:
- Are the most obvious turning points (peaks and troughs) where price clearly reversed marked?
- Have multiple timeframes (e.g., daily and 4-hour) been checked to confirm the zone's strength?
- Does the zone show at least two touches or reactions without breaking through?
- Is the zone drawn as a range (not a single line) to account for price action volatility?
- Is the most recent invalidation level (the point at which the zone would be considered broken) noted?
- Is support and resistance being used alongside other tools, such as trend analysis or momentum indicators, or in isolation?
- Have trading costs (spreads and commission) been factored in when planning entry and exit levels?
- Are there upcoming news events that could cause price to gap through zones?
- Is a stop-loss set below the entry zone to limit losses if the zone fails?
- Is the distinction between bounces (rejection and reversal within the zone) and breakouts (closing beyond the zone) clear?
Frequently asked questions
What is the difference between support and resistance?
Support is a price zone where buying interest tends to halt downward movement; resistance is a price zone where selling pressure tends to stop upward movement. Support acts as a "floor" and resistance as a "ceiling".
When support is broken, it often becomes resistance on the way back up (and vice versa).
How many times must price touch a zone before it's considered strong support or resistance?
There is no fixed rule. Treat touch counts as a conditional clue.
Generally, two or three touches without a break suggest a zone has some significance; five or more touches suggest it is stronger. However, market conditions change, and a zone that held through multiple touches can break on the next test if fundamental factors shift.
Can moving averages act as support and resistance?
Yes, moving averages can offer dynamic support or resistance. A 50-period or 200-period moving average is commonly watched. However, their effectiveness varies based on market conditions and the periods chosen.
Do not rely on moving averages alone; use them as one clue among several.
What should I do if price breaks through a support zone?
Once price closes decisively beyond a support zone (especially on a higher timeframe), consider the zone invalidated. The old support often becomes new resistance on the way back down.
If a long trade was open and price broke the support, the stop-loss should already have exited the position. Review why the zone failed (fundamental shift, volatility spike, news event) and adapt the strategy if needed.
Why do support and resistance zones sometimes fail without warning?
Markets respond to news, economic data, central bank decisions and shifts in trader sentiment. No support or resistance zone can withstand a fundamental shift in market direction.
High-impact economic releases, geopolitical events or changes in interest-rate expectations can cause price to gap through zones instantly. This is why staying aware of the economic calendar and broader market context is essential.
How do I avoid being trapped by failed breakouts?
Wait for confirmation before entering a breakout trade.
Confirmation can include a retest of the zone that holds, or a second close beyond the zone on the higher timeframe. Use a tight stop-loss just beyond the zone so that if the breakout fails, the loss is contained. Remember that no confirmation method eliminates false breakouts entirely.
Next step
Support and resistance zones are one foundational element of technical analysis for forex trading. The next practical step is to apply these concepts on a real chart using a demo account, where these ideas can be practiced, marking zones, identifying bounces and recognizing failed breakouts, without risking real funds.
NextTrade offers a free demo account on MetaTrader 5 and TradeLocker, allowing zone-marking practice on live price data. Spend time on different timeframes, daily, 4-hour and 1-hour, to understand how zone strength changes with timeframe.
Mark zones on historical price data first (where the outcome is already known), then move to current charts to build confidence.
As zone-marking skills develop, connect them with stop-loss placement strategy to create a complete trading plan. Remember that position sizing and risk management are equally important; a well-marked support zone does not guarantee profit if too much capital is risked per trade.
Risk Warning, CFDs: CFDs are complex instruments and come with a high risk of losing money rapidly due to leverage. 71% of retail investor accounts lose money when trading CFDs with this provider. Consider whether you understand how CFDs work and whether you can afford to take the high risk of losing your money. Past performance does not indicate future results.
General Information Disclosure: This article is for educational purposes and does not constitute investment advice, a personal recommendation or an offer to buy or sell any financial instrument. It does not take into account personal circumstances, investment experience or risk tolerance. Support and resistance analysis is one technical tool among many; it is not a guarantee of profitability or future price movement. Forex and CFD trading involves substantial risk of loss. Always conduct your own research and consider seeking independent financial advice before opening or funding a trading account.
TagsTrading Educationsupport and resistance forexforex support levelsresistance levels tradingsupport resistance zones