Introduction
If you’re seeking clarity and precision in your trading approach, price action trading offers a reliable and time-tested solution. Rather than relying on lagging indicators or complex algorithms, price action traders analyse raw price movement to make decisions.
In this article, we’ll explore what price action trading is, review common strategies used by professionals, and explain how concepts like candlestick patterns, support and resistance, and market psychology all come together to provide an edge in the forex trading environment.
What Is Price Action Trading?
Price action trading is the practice of analysing historical price movements to predict future market behaviour. It strips away indicators and focuses purely on price—how it moves, where it stalls, and what patterns emerge from that behaviour.
As veteran trader Al Brooks puts it:
“Price is the ultimate indicator. Everything else lags behind it.”
In essence, price action reflects all the information currently available in the market, including fundamentals, sentiment, and news. It enables traders to respond in real-time rather than react to delayed signals.
Why Traders Rely on Price Action
Here are a few reasons why many traders, from beginners to professionals, prefer price action:
- It’s adaptable to all market conditions.
- It works across all timeframes and instruments.
- It sharpens a trader’s reading of market psychology.
- It encourages disciplined, rule-based trading.
Key Price Action Strategies
Let’s walk through a few core price action trading strategies that are widely used in the forex market.
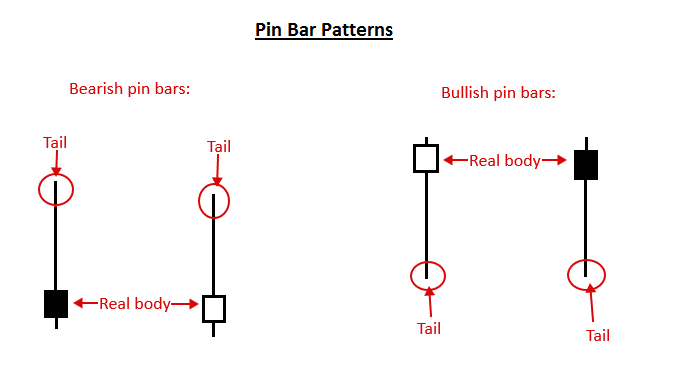
1. Pin Bar Reversals
Pin bars are candlesticks with long wicks and small bodies that signal strong rejections of price. They typically form at key support or resistance levels and indicate potential reversals.
Example Use Case:
A bullish pin bar forming at a long-term support zone could suggest that buyers are stepping back into the market.
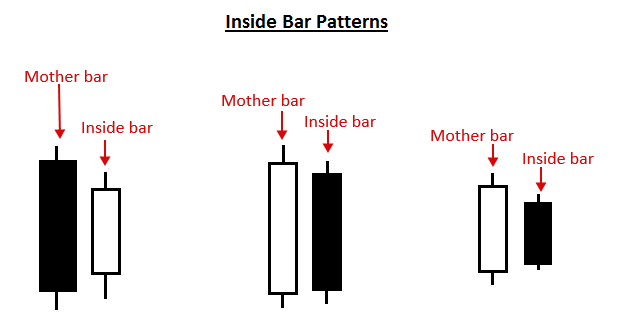
2. Inside Bars
An inside bar is a candlestick that forms completely within the range of the previous candle. It shows temporary consolidation or indecision and can signal an impending breakout.
Trading Insight:
Inside bars often appear after sharp moves. Traders typically wait for a breakout of the mother bar (the previous candle) before entering a position.
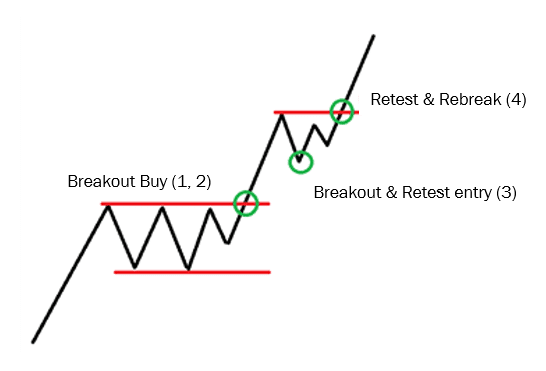
3. Breakouts and Retests
This strategy involves waiting for price to break a key level, followed by a retest of that level before continuing in the breakout direction. The retest offers confirmation and often a better risk-reward entry point.
“Markets spend more time in ranges than in trends, but when trends break, they do so decisively.”
– Steve Nison, pioneer of candlestick charting in Western markets
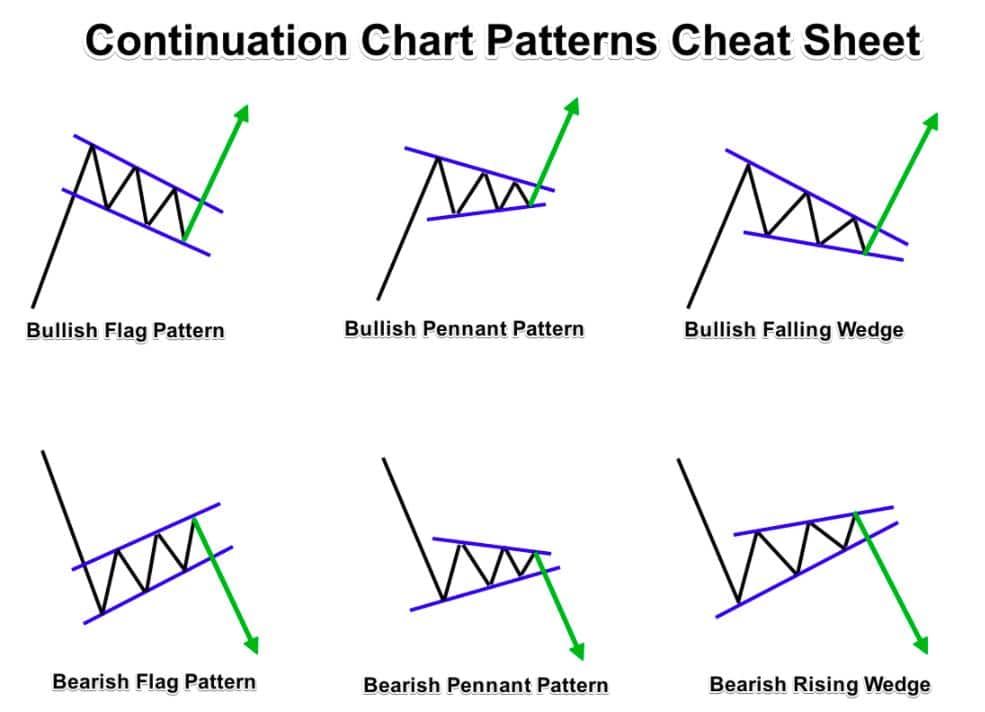
4. Trend Continuation Patterns
Patterns like bull flags, bear flags, and consolidation channels represent pauses in trending markets. Traders wait for a breakout in the direction of the trend before entering.
Pro Tip:
Combine trend continuation setups with candlestick confirmation for higher probability entries.
Understanding Candlestick Patterns
Candlestick patterns are the visual language of price action. Each candle tells a story about the battle between buyers and sellers. Some of the most reliable patterns include:
| Pattern | Signal | Ideal Use Case |
| Bullish Engulfing | Bullish reversal | After a downtrend or near support |
| Bearish Engulfing | Bearish reversal | After an uptrend or near resistance |
| Hammer | Bullish reversal | Found at market bottoms |
| Shooting Star | Bearish reversal | Found at market tops |
| Doji | Indecision / potential reversal | Found after strong moves |
Reading candlesticks in context, especially around key support and resistance zones—provides important clues for anticipating market moves.
The Role of Support and Resistance
Support and resistance levels form the foundation of price action analysis. They are horizontal zones where price has historically stalled, reversed, or consolidated.
How to Identify These Levels:
- Look for repeated swing highs or lows.
- Use round numbers (e.g., 1.1000 on EUR/USD).
- Observe reaction points on higher timeframes.
Traders use these zones for:
- Entry and exit decisions
- Setting stop losses and take-profits
- Validating candlestick signals
The Importance of Market Psychology
Every candle on a chart represents trader decisions, entries, exits, fear, greed, uncertainty, and conviction. By reading price action, you’re essentially decoding market sentiment in real time.
Examples of Market Psychology at Work:
- A long wick rejecting resistance shows buyer hesitation.
- A series of higher lows reflects growing bullish conviction.
- A false breakout reveals retail traders being trapped by smart money.
Understanding these behaviours improves timing, avoids emotional decisions, and reinforces confidence in your strategy.
Final Thoughts
Price action trading remains one of the most accessible and powerful methods for navigating the forex market. Whether you’re using it to confirm entries or as a standalone strategy, mastering it can transform your trading results.
To recap, remember:
- Simplicity is strength — remove unnecessary indicators.
- Context matters — read candlestick signals near key levels.
- Discipline pays — trust the strategy and manage risk.
At NextTrade, we’re committed to helping traders build smarter strategies and make more informed decisions. Whether you’re just starting or refining your edge, price action is a skill worth mastering.